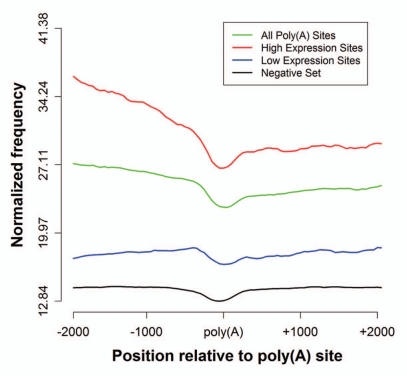
Figure 4.
Distribution of histone modifications around Poly(A) Sites. Profile was obtained by pooling all available HM ChIP-seq tags (see Methods) averaged in each 200 bp positional bin and a sliding window of 50 bp for all 3′ UTR poly(A) sites (green 31,871 sites), only the poly(A) sites belonging to high expression genes (red 7,583 sites), only the poly(A) sites belonging to the low expression genes (blue 7,577 sites) and non-poly(A) positions that form the negative set (black 87,679 sites). Profiles are centered on poly(A) sites.

