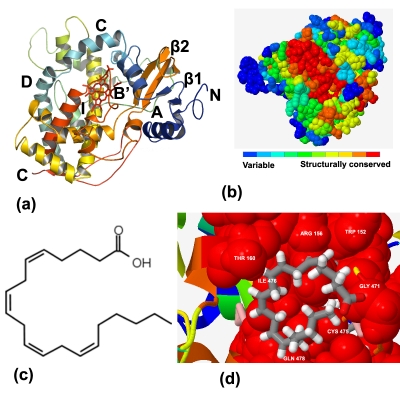
Figure 2.
(a) Ribbon schematic representation of the homology model of CYP4F22. The heme is shown in the center of the figure in red stick. Various visible regions of secondary structure elements are labeled in the figure, (b) Predicted active sites of CYP4F22, (c) 2D structure of arachidonic acid and (d) a close view of CYP4F22 with arachidonic acid. Key residues are shown in red spheres and labeled. The substrate arachidonic acid is shown as grey stick.

