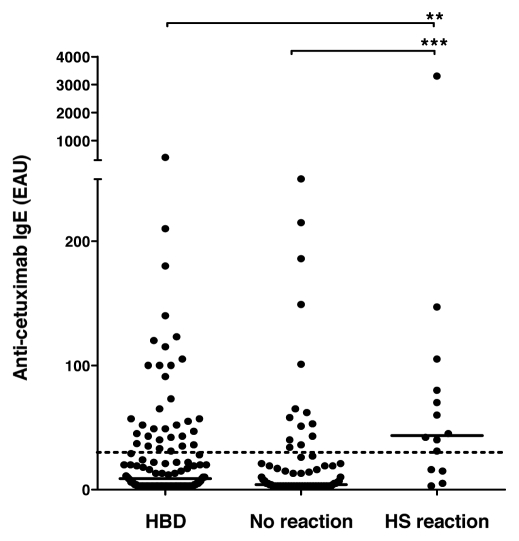
Figure 2.
Prevalence of anti-cetuximab IgE. IgE levels were measured in serum samples from a control population of healthy blood donors (HBD) and in samples collected from patients prior to receiving cetuximab treatment. Patients who showed hypersensitivity reaction (HS reaction) and those who did not (no reaction) were included in the study. Median value per group is given as a horizontal bar. Dotted line corresponds to the threshold calculated by the ROC analysis of 29 EAU. ***significant difference between HS group and patients without reaction (p < 0.001); **significant difference between HS group and control population (p < 0.01).

