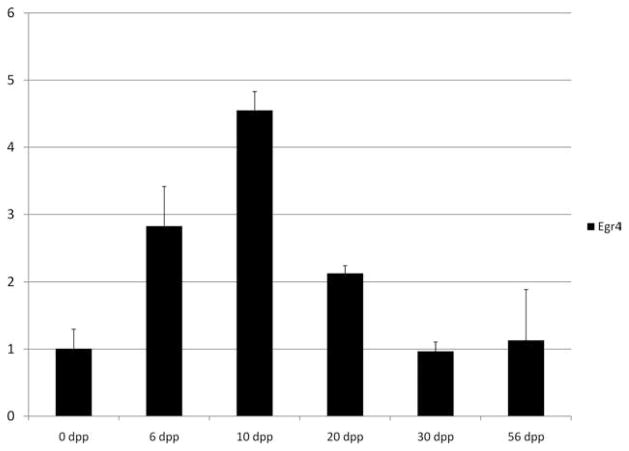
Fig. 1.
Egr4 expression profile during testis development. Real-time polymerase chain reaction used to determine the levels of Egr4 transcript in total testis RNA samples from mice collected at 0, 6, 10, 20, 30, and 56 days post partum (dpp; X axis). Data are presented as the relative fold change (Y axis) compared with the 56 dpp testis sample. Error bars represent mean ± standard deviation, n = 2.

