Fig. 6.
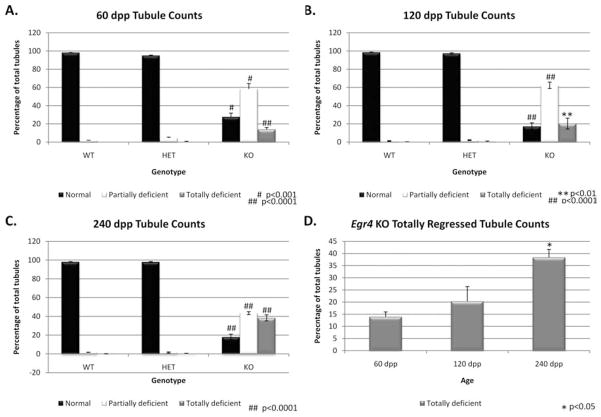
Egr4-deficient mouse testis tubule scoring. A–C: Column graphs depicting the percentage of normal (black), partially regressed (white) and totally regressed (gray) tubules in Egr4 wild-type (WT), heterozygous (HET), and knockout (KO) testes at 60 dpp (A), 120 dpp (B), and 240 dpp (C). D: Column graph depicting only the numbers of totally regressed tubules in Egr4 deficient testes at 60, 120, and 240 dpp. Statistical significance was determined using a Student’s t-test with JMP-7 software and the representative P values are given on each graph.

