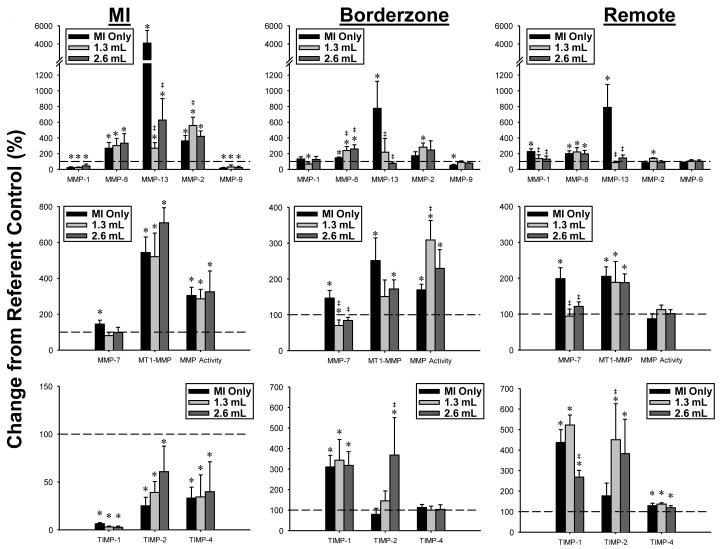
Figure 3.
Percent change from referent control values in the abundance of the matrix metalloproteinases (MMPs), MMP activity, and tissue inhibitors of metalloproteinases (TIMPs) in the MI, borderzone, and remote regions at 8 weeks after MI. The dashed line represents the referent control value set to 100%. MMP-13 was robustly increased in all regions of the MI Only group and returned toward referent control values with CHAM treatment. In the remote region, MMP-1 and MMP-7 were normalized toward control value by CHAM treatment. MMP activity determined by a fluorogenic assay approach, was similar between groups. Within the borderzone, MMP-13 levels and MMP-7 levels were lower, but again MMP activity was either similar or higher with CHAM treatment. * p<0.05 vs referent control, ‡ p<0.05 vs MI Only, § p<0.05 vs 1.3 mL treatment group. Treatment groups, Sample sizes: MI Only (n=13), 1.3 mL CHAM (n=6), 2.6 mL CHAM (n=5)

