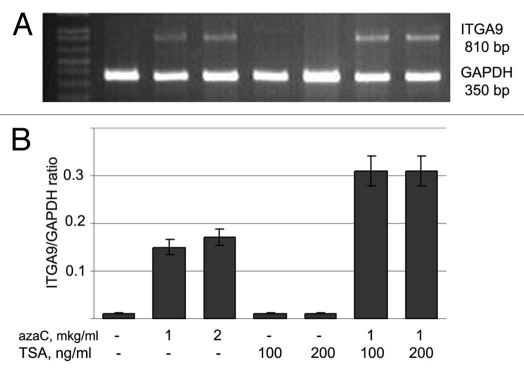
Figure 5.
Activation of ITGA9 expression in MCF7 breast carcinoma cells by 5-deoxyazacytidine treatment. (A) Representative gel showing ITGA9 amplified by multiplex RT-PCR. (B) Intensity of the amplified ITGA9 DNA fragments normalized to that of GAPDH (TotalLab Programme). Bars represent the mean ± SD from triplicate experiments (OriginPro 8.1). The lane order on the gel corresponds to the bars on the histogram. 5-aza-dC, 5-azadeoxycytidine; TSA, Trichostatin A.

