
FIG. 2.
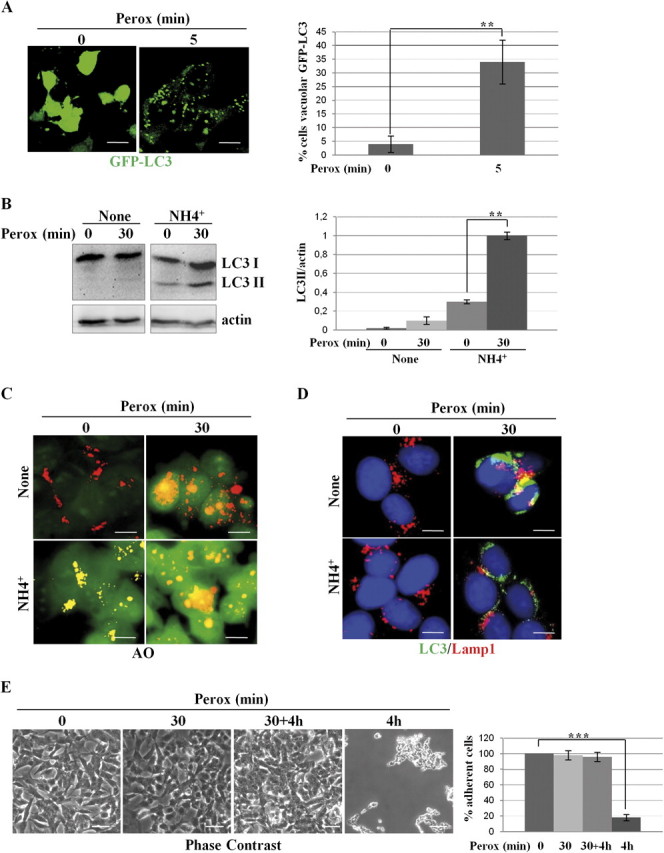

H2O2 rapidly triggers protective autophagy in SH-SY5Y cells. (A) Transfected SH-SY5Y cells expressing the fluorescent chimeric protein GFP-LC3 were exposed or not to 200μM H2O2 (perox). The diffuse cytoplasmic fluorescence in control (Co) cells assumes a punctate pattern soon after (5 min) exposure to H2O2. Estimation of the proportion of cells presenting > 10 positive puncta/cell is reported. (B) Western blotting showing the appearance of the autophagosome marker LC3 II in cells exposed to H2O2 (perox, 30 min) in the absence or the presence of the weak base ammonium chloride (NH4Cl). The densitometry ratio of LC3 II normalized versus actin from three independent experiments is reported. (C) H2O2 increases the number and the volume of acidic vacuolar compartments stained with the acidotropic fluorochrome Acridine Orange. NH4Cl determines the alkalinization and swelling of acidic compartments in > 90% of the cell population. (D) H2O2 stimulates the formation of LC3-Lamp1 double-positive autophagolysosomes. NH4Cl largely (> 75%) prevented the fusion of LC3-positive autophagosomes with Lamp1-positive endosomes and lysosomes. (E–F) Cells incubated for 4 h in the absence of H2O2 or incubated for 30 min in the presence of H2O2 (perox) or incubated for 30 min in the presence of H2O2, then rinsed, and further incubated for 4 h in fresh medium (perox 30 min + 4 h, or incubated for 4 h in the presence of H2O2. Panels in (E) show the phase-contrast image of the monolayers, whereas panels in (F) show the immunofluorescence in cells labeled for LC3 and Lamp1. Representative images of three independent experiments are shown. Bar = 10 μm. Quantification and statistic is presented (note that at 4 h < 10% of the initial cell population was still attached on coverslip). (G) Western blotting of ser473-pAkt and of total Akt in cell homogenates of parallel cultures incubated as for the experiments described in (E). The filter was stripped and probed for actin as marker of protein loading. One representative gel out of three independent experiments is shown. The densitometry ratio of pAkt/total Akt is reported. Statistical significance between relevant treatments is indicated.