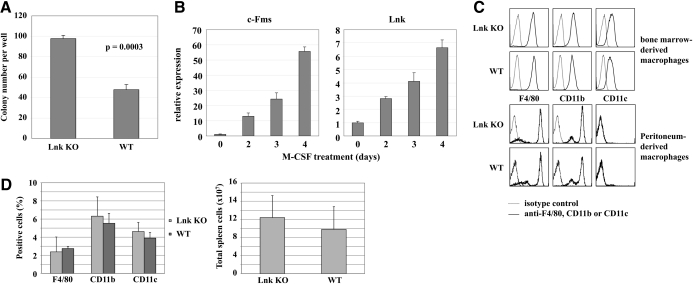
Figure 2. Effect of Lnk on proliferation and differentiation of macrophages.
(A) M-CFUs in Lnk KO and WT bone marrow. Mononuclear bone marrow cells were harvested from Lnk KO and WT mice, and 1000 cells/well were plated in methylcellulose medium supplemented with M-CSF in triplicates. After 7 days, colonies were counted. The graph demonstrates 1 of 3 independent experiments with similar results. Results represent the means and sd of 3 plates/experimental round. (B) Lnk mRNA expression during macrophage differentiation. Mononuclear cells were isolated from bone marrow of WT 129/Sv mice, plated in complete RPMI medium supplemented with M-CSF for 2–4 days, and total RNA was extracted from the cells at the indicated time-points. Expression levels of c-Fms and Lnk are shown as the means and sd of triplicate culture dishes using real-time PCR and normalized to 18S expression. The graph shows results from 1 of 2 similar experiments. (C) Surface marker expression of Lnk KO and WT macrophages. Bone marrow-derived macrophages from WT and Lnk KO mice were differentiated in vitro for 7 days (upper chamber). Peritoneum-derived macrophages (lower chamber) were harvested 96 h after i.p. injection of thioglycollate. Cells were stained with fluorescent antibodies against F4/80, CD11b, and CD11c, as well as with the relevant isotype controls. Levels of surface marker expression were detected using a FACSCalibur immunocytometry system. (D) Macrophage populations in spleens of WT and Lnk KO mice. Total cells were extracted from spleens of WT and Lnk KO mice and stained with fluorescent antibodies against F4/80, CD11b, and CD11c (upper diagram). Total spleen cell numbers are shown in the lower diagram.

