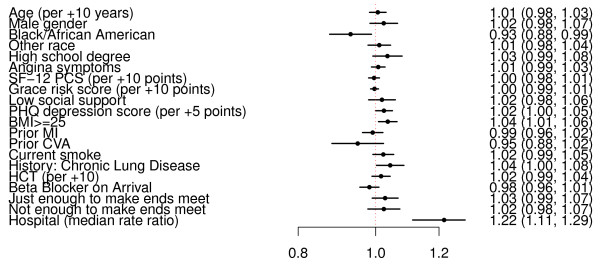
Figure 2.
Multivariable model of participation in genetic sub-study. Variables included in the model are shown along the vertical axis. The strength of effect is shown along the horizontal axis with the vertical dotted line demarking a rate ratio of 1 (that is, no effect); estimates to the right (that is, > 1) are associated with greater likelihood of genetic consent while those to the left (that is, < 1) indicate association with reduced likelihood of genetic consent. Each dot and line represents the point estimate of the effect of that variable in the model, while the line shows the 95% confidence interval. CVA, Cerebral Vascular Accident; HCT, hematocrit; PHQ, Patient Health Questionnaire; SF-12 PCS, short form 12 physical component score.

