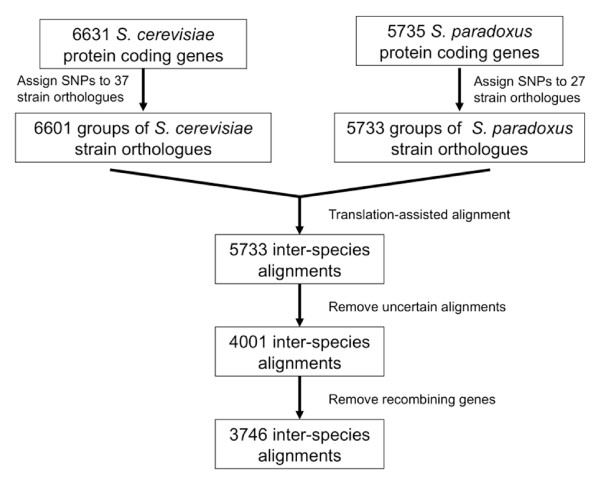
Figure 1.
Flow chart illustrating the initial processing of the source data. The diagram show the steps involved in creating multiple alignments including S. cerevisiae and S. paradoxus strains as well as the number of genes involved at each step. Filtering steps for removal of uncertain alignments are also shown. See Materials and methods for details.

