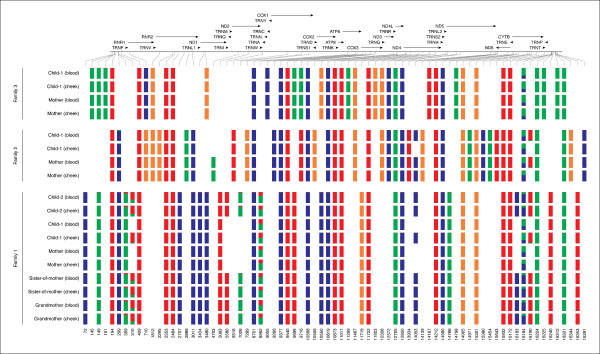
Figure 3.
A representation of all differences found between each sequenced individual and the reference human mtDNA from genome build hg19. The colored bars (blue = A, green = C, orange = G, red = T) represent the frequency of a given allele in each sample. For example, at position 8,992 one can clearly see a heteroplasmy with two high frequency alleles C and T. Lines on top of the image represent location and orientation of mitochondrial genes. F1 = Family F4, F2 = Family F7, F3 = Family F11.

