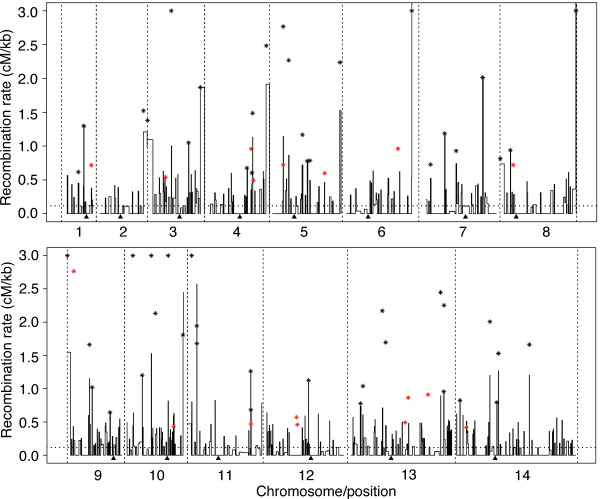
Figure 3.
Plot of recombination rate of the 7G8 × GB4 cross showing recombination hotspots along each of the 14 P. falciparum chromosomes. A region was considered a recombination hotspot (asterisks) if there were two or more recombination events across the 32 progeny and the estimated recombination rates were higher than the chromosome-wide average rate by five-fold or more. The 14 chromosomes are as marked and separated with the vertical dashed lines. The black asterisks are hotspots from the 7G8 × GB4 cross, and the red asterisks indicate hotspot positions from the Dd2 × HB3 cross. The arrowheads under each panel indicate the positions of putative centromeres for the 14 chromosomes according to [11].

