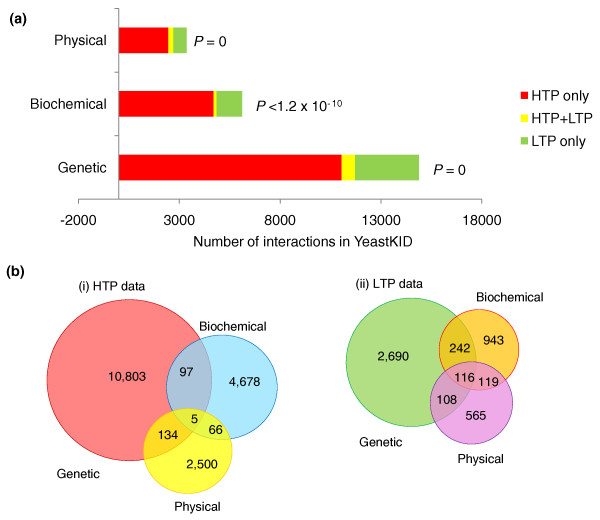
Figure 4.
Comparison of the relative amounts of genetic, physical and biochemical HTP and LTP data for kinases. (a) Bar graph illustrating the relative amounts of genetic, physical and biochemical interactions in HTP, LTP and both data forms. P-values indicate significance of the overlap in a given interaction space. (b) Overlap of all three assays in HTP and LTP methods. LTP data show the largest overlap between genetic, physical and biochemical approaches, while HTP data show little overlap.

