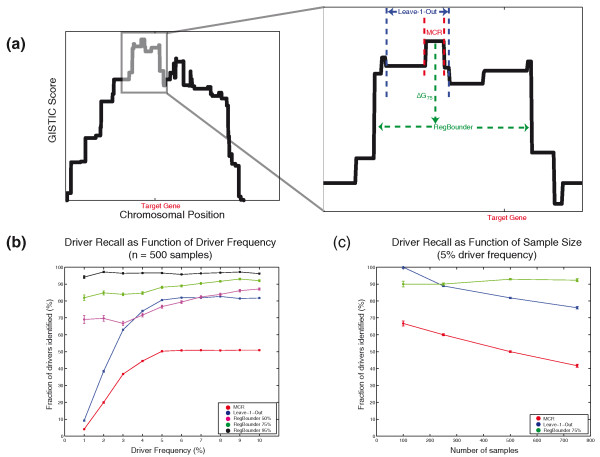
Figure 5.
Sensitivity of peak finding algorithms. (a) Schematic diagram demonstrating various peak finding methods. The left panel shows the GISTIC score profile for a simulated chromosome containing a mix of driver events covering the denoted target gene and passenger events randomly scattered across the chromosome. The inset at right shows the region around the maximal G-score (gray box in left panel) in higher detail. The MCR (red dotted lines) is defined as the region of maximal segment overlap, or the region of highest G-score. The leave-k-out procedure (blue dotted lines, here shown for k = 1) is obtained by repeatedly computing the MCR after leaving out each sample in turn and taking as the left and right boundaries the minimal and maximal extent of the MCR. RegBounder works by attempting to find a region (dotted green line) over which the variation between boundary and maximal peak score is within the gth percentile of the local range distribution (Supplementary Methods in Additional file 1). Here, RegBounder produces a wider region than either the MCR or leave-k-out procedures, but is the only method whose boundary contains the true driver gene. (b,c) The average fraction of driver events contained within the peak region (conditional on having found a GISTIC peak within 10 Mb) is plotted as a function of driver-frequency (b) or sample size (c) for the MCR (red), leave-1-out (blue), and RegBounder algorithms (the latter at various confidence levels: 50%, magenta; 75%, green; 95%, black). In (b), data are derived from 10,000 simulated chromosomes across 500 samples in which the driver frequency varied from 1 to 10%. In (c), data are derived from 10,000 simulated chromosomes across a variable number of samples in which the driver frequency was fixed at 5%. Error-bars represent the mean ± standard error of the mean (some are too small to be visible).

