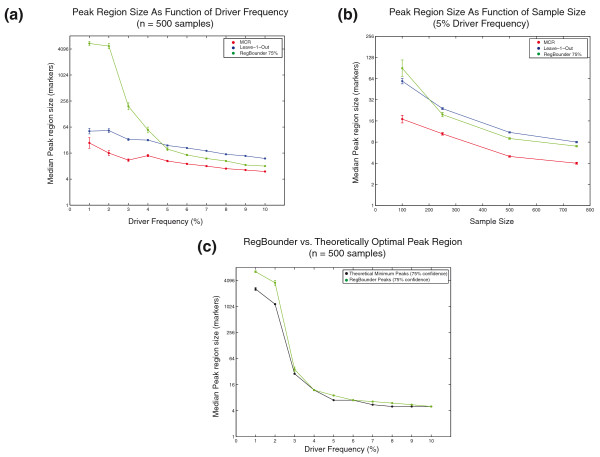
Figure 7.
Specificity of peak finding algorithms. (a,b) The median size of the peak regions produced by the MCR (red), leave-1-out (blue), and RegBounder (green, 75% confidence) are shown as a function of driver frequency (a) and sample size (b). In (a), data are derived from 10,000 simulated chromosomes across 500 samples in which the driver frequency varied from 1 to 10%. In (b), data are derived from 10,000 simulated chromosomes across a variable number of samples in which the driver frequency was fixed at 5%. (c) Comparison of the peak region sizes obtained by RegBounder (green line) with the theoretically minimal peak region sizes (black line) that could be obtained by any peak finding algorithm with a similar confidence level (Supplementary Methods in Additional file 1). Error-bars represent the mean ± standard error of the mean (some are too small to be visible).

