
Figure 3.
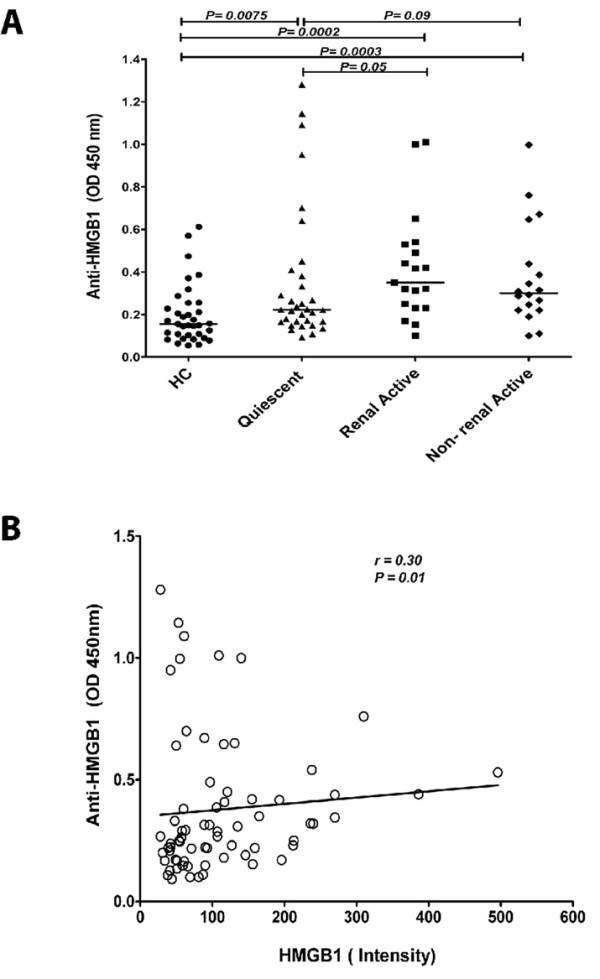
Anti-HMGB1 levels in SLE patients and their relation to HMGB1. A) Anti-HMGB1 levels in SLE patients compared to HC. Horizontal lines represent the levels expressed as median. B) Positive correlation between levels of HMGB1 and anti-HMGB1 antibodies.