
Figure 1.
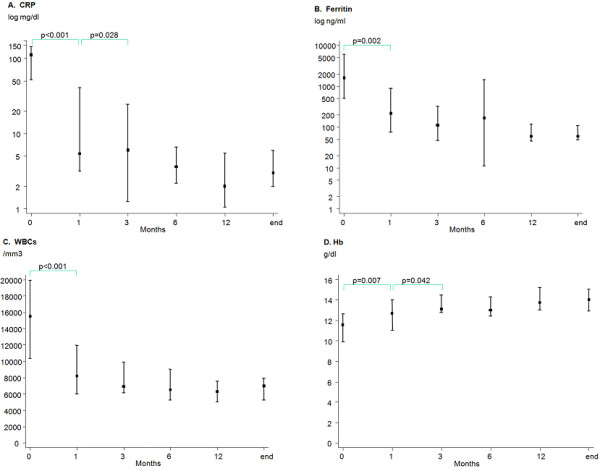
Graphical presentation of the median values and 25th/75th percentiles of (a) CRP levels, (b) ferritin levels, (c) WBC count, and (d) Hb levels during follow up. In a and b the logarithmic values of C-reactive protein (CRP) and ferritin levels are provided. Hb, hemoglobin; WBCs, white blood cells.