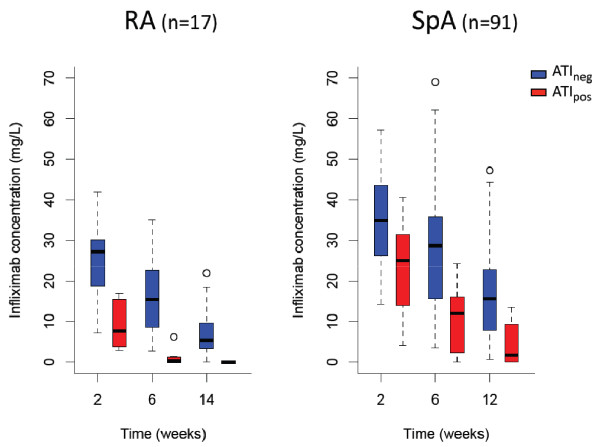
Figure 2.
Infliximab concentrations at initiation in ATIpos and ATIneg patients. Box plots show the medians and interquartile ranges, and whisker plots represent the 95th percentiles. ATI: antibodies toward infliximab; ATIpos: ATI detected at least once during follow-up; ATIneg: ATI not detected; RA: rheumatoid arthritis; SpA: spondyloarthritis.

