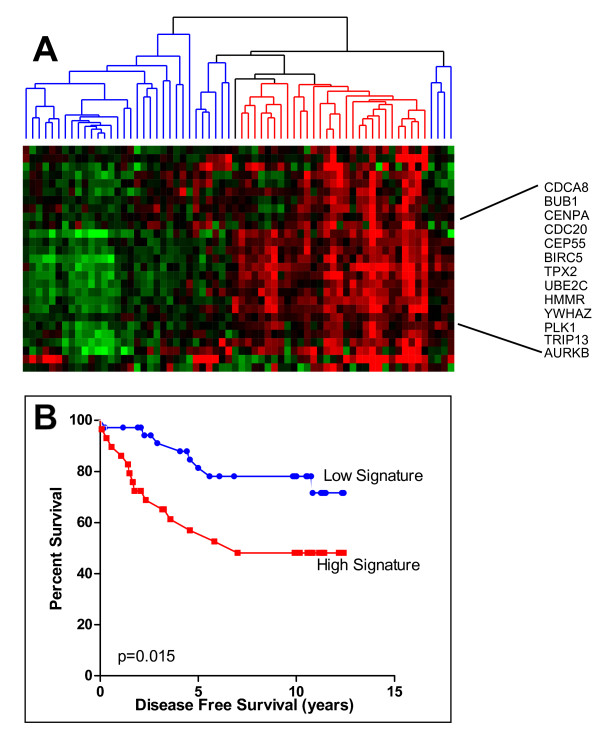
Figure 1.
Identification of a 14-3-3ζ gene signature. (a) 29 genes associated with high levels of 14-3-3ζ were identified and clustered based on their expression profile. Hierarchical clustering identified a subgroup of patients (red) characterized by elevated levels of mitosis and cytokinesis related genes. (b) Kaplan-Meier curves for the red and blue clusters of the hierarchical diagram in panel (a) distinguished between good (blue, signature low expression) and poor prognosis (red, signature high expression) patients (P = 0.015).

