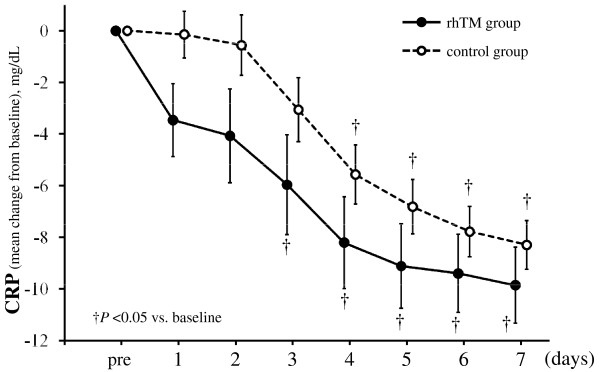
Figure 4.
Serial changes from baseline in levels of CRP in the two groups. Data are expressed as group means ± standard error of the mean. CRP level decreased over time in both groups (P < 0.001). Although CRP level in the rhTM group tended to decrease more than that in the control group, the decrease did not reach statistical significance (P = 0.144). There was no interaction between treatment and time (P = 0.812). The last-observation-carried-forward method of imputation was used for missing data. The imputation was accomplished in a total of six values in one patient for the rhTM group and in a total of 51 values in 12 patients for the control group. †P < 0.05 compared to baseline. CRP, C-reactive protein; rhTM, recombinant human soluble thrombomodulin.

