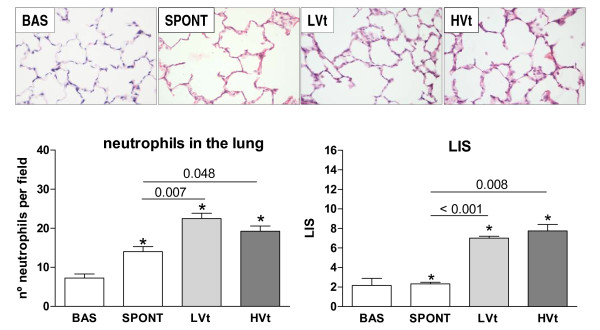
Figure 2.
Representative images of lungs in each group after H-E staining and LIS. The percent of lung neutrophil content and LIS increased with MV but was similar in animals receiving LVt and HVt. Results are represented as mean ± SE. *P < 0.05 versus the unventilated basal group. N = 8 animals per group. Abbreviations: BAS, basal; LVt, low tidal volume; HVt, high tidal volume; Spont, spontaneous breathing; LIS, Lung injury score.

