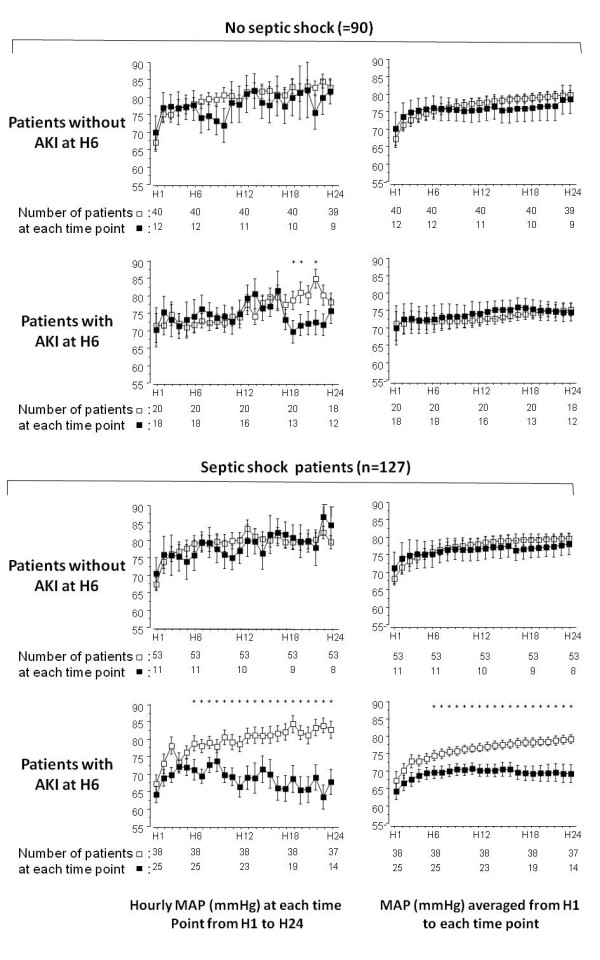
Figure 4.

Mean arterial pressure (MAP) according to the presence of septic shock or acute kidney insufficiency. The MAP (from H6 to H24 for hourly MAP and for time-averaged MAP) was significantly lower in patients who will than in those who will not have AKI at H72 only in the sub-group of patients with septic shock and AKI at H6 (as indicated by an asterisk upon each time point in the bottom panels). Asterisks upon time points indicate a significant difference (P < 0.05) between patients who will have AKI at H72 (black squares) and those who will not (open squares) (post hoc comparison after analysis of variance). Error bars represent standard errors.
