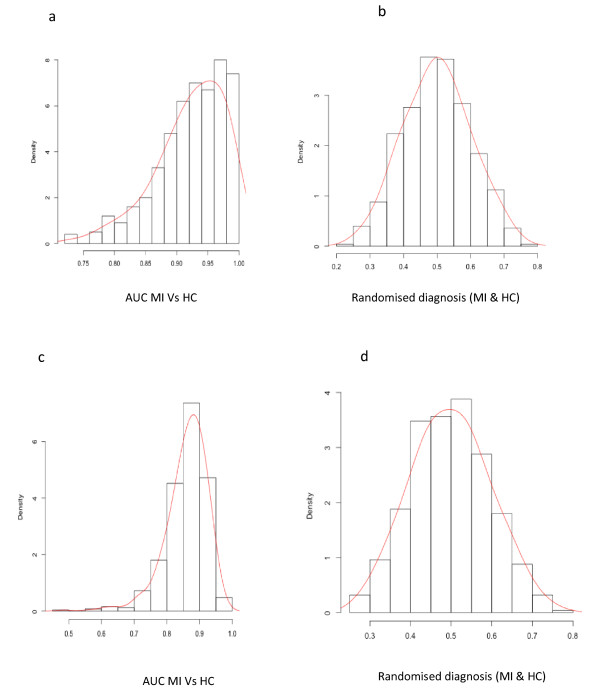
Figure 4.
AUC ROC permutation comparisons and distribution graphs between mixed inflammation and Healthy Control cohorts. A and B display results for the AUC ROC following 500 iterations using the full gene set and distribution results when cohort labels are removed, respectively. In C and D this analysis was repeated using a diagnostic signature that is operating with a set of seven genes, where minimal change in performance was noted.

