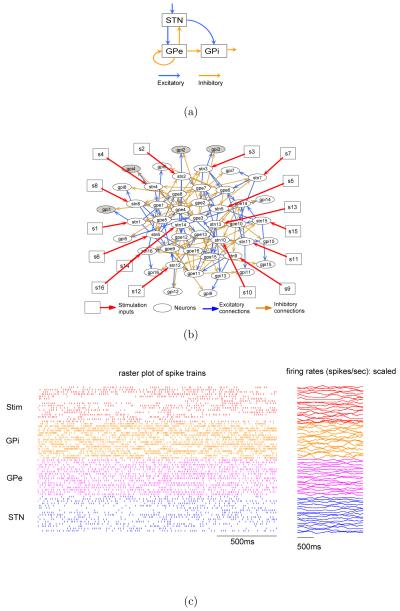
Figure 1.
A Basal Ganglia microcircuit. (a) High level block diagram of the BG circuit. (b) Detailed synaptic connectivity of the BG circuit. The external microstimulation inputs are marked by squares and red arrows. (c) BG microcircuit under patterned stimulation. Episodes of stimulation pulse trains are randomly generated according to a Poisson distribution with randomly reinforced silence period between successive episodes. Left panel shows a two-second raster plots of the stimulation pulse trains and the spike trains from all neurons in the network. Right panel shows the firing rates (scaled to fit the window) computed from the spike trains shown in left panel over a sliding window of 200ms.

