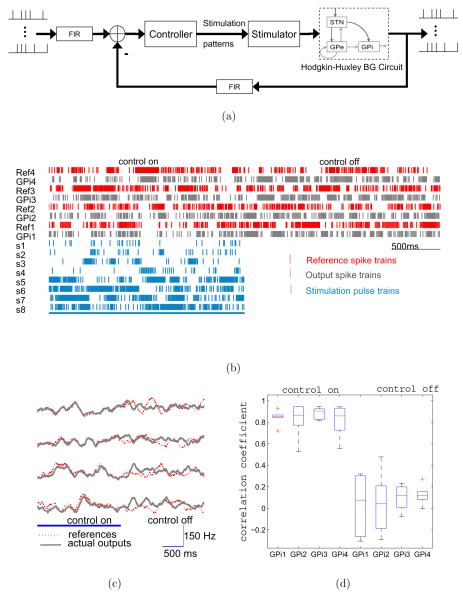
Figure 6.
Tracking performance of the decentralized closed-loop feedback controller. (a) Block diagram of the detailed implementation of the closed-loop feedback control system. (b) The raster plot of the reference and output spike trains before and after the controller is switched off. The raster plot of the stimulation input spike trains are also shown. (c) Same results as in (b) but plotted in firing rates (sliding window of 200 ms). (d) The box plot of the correlation coefficients for each output GPi neuron with and without feedback control.

