Abstract
The growing fetus depends upon transfer of glucose from maternal blood to fetal tissues. Insulin and glucocorticoid impact maternal glucose metabolism, but the effects of these hormones on fetal glucose assimilation in vivo are understudied. We thus used positron emission tomography imaging to determine the disposition of [18F]fluorodeoxyglucose (FDG) in rats on gestational d 20, quantifying the kinetic competition of maternal tissues and fetus for glucose. Three fasting maternal states were studied: after 2-d dexamethasone (DEX), during euglycemic hyperinsulinemic clamp insulin receiving (INS), and control (CON). In CON and DEX mothers, FDG accumulation in fetuses and placentae was substantial, rivaling that of maternal brain. By contrast, FDG accumulation was reduced in INS fetuses, placentae, and maternal brain by approximately 2-fold, despite no diminution in FDG extraction kinetics from maternal blood into these structures. The reduced FDG accumulation was due to more rapid clearance of FDG from the circulation in INS mothers, related to increased FDG avidity in INS select maternal tissues, including skeletal muscle, brown adipose tissue, and heart. DEX treatment of mothers reduced fetal weight by nearly 10%. Nonetheless, the accumulation of FDG into placentae and fetuses was similar in DEX and CON mothers. In our rat model, fetal growth restriction induced by DEX does not involve diminished glucose transport to the fetus. Maternal insulin action has little effect on the inherent avidity of the fetal-placental unit for glucose but increases glucose utilization by maternal tissues, thus indirectly reducing the glucose available to the fetus.
PET imaging quantifies strong competition of the fetus/placenta for maternal glucose that is unaffected by dexamethasone or insulin, except that insulin enhances maternal tissue glucose uptake.
The fetus depends upon transfer of glucose from the maternal circulation for use as an energy source (1,2) and growth substrate (3). It is thus not surprising that derangements in maternal glucose homeostasis perturb fetal growth and health. For example, exposure of the fetus to excess glucose increases risk of large birth weight for gestational age, neonatal hypoglycemia, respiratory distress syndrome (4), and type 2 diabetes later in life (5). Conversely, exposure of the fetus to maternal hypoglycemia increases risk of small birth weight for gestational age (6,7), and transport of glucose to the fetus is essential for late gestational growth (3).
Because both fetal and maternal tissues take up glucose from the maternal circulation, there is a de facto competition for glucose between the growing fetus and maternal tissues. For maternal tissues, the uptake of glucose is subject to well-studied regulations, for example by insulin, which maintain euglycemia. By contrast, the regulation of glucose uptake into the fetus via the placenta is less well understood (8). The transfer of glucose across the placenta to the fetus is mediated primarily by the constitutive glucose transporter (GLUT)1 and GLUT3 (3,9,10). These proteins act by facilitated diffusion, and thus transport will be strongly influenced by the relative glucose concentrations in the maternal and fetal blood.
Insulin and glucocorticoids exemplify factors that strongly regulate maternal glucose metabolism but whose direct effects on placental glucose transport are unclear. Insulin increases glucose uptake into maternal skeletal muscle and other insulin-sensitive tissues. However, it is not clear whether insulin regulates placental delivery of glucose to the fetus in vivo (8). Likewise, the effect of glucocorticoids on placental transport of glucose to the fetus in vivo has been poorly studied (8). Paradoxically, chronic excesses of glucocorticoid reduce fetal growth (11,12,13,14) despite increasing maternal glycemia (15,16) and possibly up-regulating GLUT1 and GLUT3 expression (17).
To help address these uncertainties, this study used positron emission tomography (PET) imaging to simultaneously track glucose uptake in maternal tissues and the fetuses/placentae using the tracer [18F]fluorodeoxyglucose (FDG). This allowed determination, for maternal organs and the fetuses/placentae, of 1) their total glucose uptake and 2) their glucose avidity. The PET imaging was performed during late gestation in maternal rats during baseline conditions, hyperinsulinemic euglycemic clamp, and under excess glucocorticoid action. Thus, we determined the impact of maternal hyperinsulinemia vs. glucocorticoid action on maternal:fetal glucose competition in vivo. We hypothesized that these hormones would have little impact on the inherent avidity of placentae/fetuses for glucose. Indeed, our studies show that glucocorticoid has little impact on maternal or fetal glucose uptake, whereas insulin, by contrast, reduces total glucose tracer accumulation in the fetus. We find that this effect is not due to changes in placental glucose transport capability but rather is due solely to enhanced glucose uptake into selected maternal tissues, thus outcompeting the fetal-placental unit.
Materials and Methods
Animals
All procedures were performed within the regulations of the Animal Welfare Act and the National Institutes of Health Guide for the Care and Use of Laboratory Animals and were approved by the Institutional Animal Care and Use Committee of the University of Iowa. Timed, pregnant Harlan Sprague Dawley rats (Hsd:Sprague Dawley SD; Harlan Laboratories, Inc., Indianapolis, IN) were purchased to arrive in our facility on gestational d 11. The vendor defined gestational d 0 as the day of initial vaginal plug detection. On gestational d 18, vascular catheters were placed draining into the left-sided uterine artery as described (18). Right-sided femoral artery and vein catheters were placed in a portion of animals. Catheters were tunneled sc to a midscapular exit and connected to a dual channel infusion swivel (Instech Laboratories, Plymouth Meeting, PA) allowing the rat freedom of movement. Saline with 5 U/ml heparin was infused at 10 μl/min to maintain catheter patency.
Dexamethasone (DEX) was administered twice daily at 0.3 mg/kg · d, a dose known to reduce fetal growth (19), to a portion of the rats (DEX) sc in normal saline on gestational d 18–20. The insulin receiving (INS) and control (CON) groups have been partially described in a report focused on the first-pass exposure of the left-uterine horn (18). INS rats were subject to euglycemic hyperinsulinemic clamp starting 98 ± 3 min before PET imaging, infusing insulin via the right-femoral vein at 20 mU/kg · min and glucose via the same catheter to maintain blood glucose at 90 mg/dl (18). The glucose infusion rate was at steady state through the PET imaging interval (Supplemental Fig. 1A, published on The Endocrine Society’s Journals Online web site at http://endo.endojournals.org). Serum insulin levels were increased 51 ± 11-fold by the insulin infusion (Supplemental Fig. 1B).
PET imaging
On gestational d 20 (delivery typically would occur on d 21 or 22), rats were anesthetized with 1.5% isoflurane after overnight fast and underwent PET imaging (18). Starting at time 0, FDG was infused over approximately 10 min into the left-uterine artery catheter. Dynamic PET images of the abdomen were collected at intervals for the first 90 min followed by a whole-body image of the rat excluding the tail, acquired at 90–120 min. Right femoral artery and tail blood were collected at regular intervals for determination of 18F concentration. At 150 min, maternal tissues, fetuses, and placentae were collected by Caesarean section after euthanasia of the rat and anesthesia of its fetuses with 150 mg/kg iv pentobarbital. Samples were immediately blotted dry and weighed. The 18F content of tissues and serum were determined by calibrated γNaI well-counter. All radioactivity determinations were decay corrected to the start of the radiotracer infusion.
PET analysis
PET images were reconstructed as described (18), and volumes-of-interest (VOIs) were defined manually. All images were attenuation and decay corrected. Standardized uptake values (SUV) based on PET (SUVPET) or well-counter (SUVwell) measures of activity were calculated as
 |
 |
where CPET is the mean 18F concentration of the VOI determined by PET and Cwell is the 18F concentration of the tissue sample determined by weighing and well-counting. Time-activity curves were determined for VOIs across the dynamic imaging sequence. The FDG avidities of maternal tissues, placentae, and fetuses were determined by two approaches, Patlak modeling (20), and fractional uptake rate calculation (21), deriving KPatlak and KFUR respectively. KPatlak was determined from the time-activity curve data and time-series serum 18F counts using PMOD 3.0 (PMOD Technologies, Zurich, Switzerland). The fractional uptake rate, corrected for changing glycemia (22) K’FUR, was calculated from well-counter data as
 |
where Cs(t) is the serum concentration of 18F at time t, and Gs(t) is the serum glucose concentration at time t. FDG metabolic rates (23) based on PET (MRFDG,PET) or well-counter (MRFDG,well) data were calculated as
 |
 |
where LC is the lumped constant assumed to be 1 (23), Ḡs is the average serum glucose during the scan, and Ḡs,t=0 and Ḡs are the baseline and mean during-scan serum glucoses averaged across all scans. MRFDG,well is adjusted by solely the baseline serum glucose, because K’FUR is already adjusted for changing glycemia during the scan. Because the left-uterine horn received first-pass FDG exposure (18), only the right-uterine horn was subject to analysis in this study.
Statistical analyses
Error bars represent sem. Comparisons between two independent samples were performed using two-tailed homoscedastic Student’s t test. Paired samples were compared using two-tailed repeated measures t test. When comparing three groups, significance was determined by one-way ANOVA, using Tukey’s honestly significant difference (HSD) test to assess for pairwise differences between groups. Individual fetal measurements were averaged for each mother and statistical comparisons made at the maternal level. Exceptions to this approach are indicated by “n” referring to the numbers of fetuses, not mothers, compared.
Results
Maternal characteristics
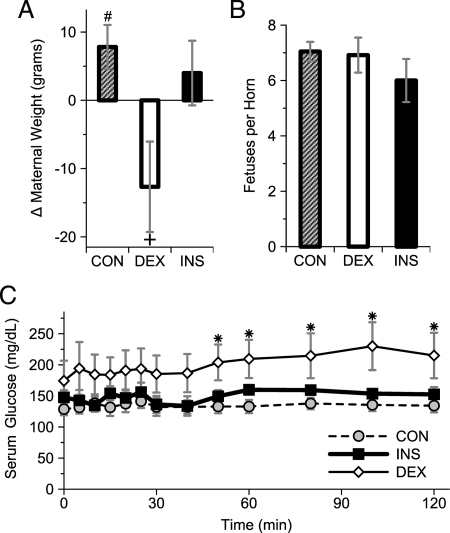
Three maternal states, all fasting, were studied by PET imaging on gestation d 20: DEX treatment on gestational d 18–20 (DEX), during euglycemic hyperinsulinemic clamp (INS), and CON. Among CON rats, there was a significant increase from the presurgical to prescan total weight (Fig. 1A). By contrast, DEX rats lost weight during the same interval, whereas the change in weight among INS rats was indistinguishable from CON. The number of fetuses per uterine horn was similar between the three groups (Fig. 1B). Across all groups, there were 1.5 ± 0.7 fewer fetuses (P < 0.05, n = 23 mothers) on the left- compared with the right-uterine horns (data not shown). There was no evidence of fetal resorption accounting for this difference, which likely represents the natural difference in fetal abundance between the two uterine horns (24). Prescan/clamp blood glucose was not statistically different between the groups: CON, 77 ± 6 mg/dl (n = 11); DEX, 83 ± 7 (n = 6); and INS, 96 ± 8 (n = 6) [P = not significant (n.s.)]. The reasons for the differing glucose tendencies were unclear but perhaps merely reflect the small n. The serum glucose during PET imaging was similar between the euglycemic hyperinsulinemic clamp (INS) and CON groups. However, among DEX mothers, the serum glucose was higher, becoming statistically different than CON by the latter parts of the scan (Fig. 1C).
Figure 1.
Maternal characteristics. A, Change in total maternal weight (i.e. including fetal-placental units) from immediately before catheter placement (gestational d 18) until just before PET (gestational d 20) in CON, DEX-treated, or INS rats. #, P < 0.05 for increase in weight, n = 11 mothers by paired t test; +, P < 0.05 vs. change in DEX vs. CON, n = 6–11 mothers by ANOVA/Tukey’s HSD and P < 0.05 for negative interval change in weight by z-test. B, Fetuses per uterine horn; n = 6–11 mothers; P = n.s. C, Serum glucose during PET. *, P < 0.05 for DEX vs. CON by ANOVA and Tukey’s HSD, n = 6–11 mothers.
Fetal responses
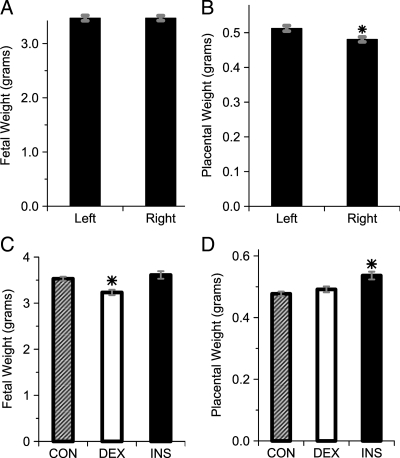
The presence of the left-uterine artery catheter did not alter fetal growth, as evidenced by no difference in weight between fetuses in the left- and right-uterine horns (Fig. 2A). Placental weight was greater on the side of the infusion catheter (Fig. 2B). As expected (25), DEX treatment of mothers on gestational d 18–20 induced a small but statistically significant reduction in fetal weight (Fig. 2C). By contrast, placental weight was not affected by DEX but was modestly increased among INS rats compared with DEX and CON (Fig. 2D).
Figure 2.
Fetal parameters on gestational d 20. A, Fetal weights in the left- and right-uterine horns across all groups. P = n.s. for difference between sides, n = 138–172 fetuses per side (from 23 mothers). B, Placental weights in the left- and right-uterine horns across all groups. *, P < 0.005, n = 138–172 fetuses per side (from 23 mothers). C, Fetal weight by treatment group. *, P < 0.0005 vs. CON and INS, n = 72–155 fetuses per group (from six to 11 mothers per group). D, Placental weights by treatment group. *, P < 0.01 vs. CON and DEX, n = 72–155 fetuses per group (from six to 11 mothers per group).
Temporal glucose disposition
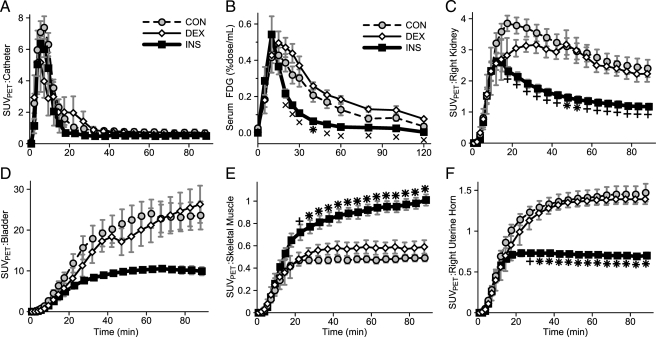
Dynamic PET imaging and serum sampling were used to characterize the temporal distribution of the glucose analog tracer, FDG, in the three conditions. FDG was infused over approximately 10 min of time. This infusion was readily observed by PET in the catheter region and showed no significant difference between the three conditions (Fig. 3A). The resultant serum 18F concentration curves reflect the infusion, peaking at 15–20 min (Fig. 3B). As might be expected, serum FDG was cleared more rapidly in INS mothers. FDG rapidly appeared in the kidneys, with significantly less observed in the INS mothers likely due to more rapid FDG clearance from the serum (Fig. 3C). Large amounts of FDG accumulated in the bladder (Fig. 3D) with a similar relative pattern, although delayed, as that observed in the kidneys. Skeletal muscle in CON and DEX mothers captured little FDG, but this was significantly increased in INS mothers (Fig. 3E). By contrast, the right-uterine horn region, consisting primarily of fetuses and placentae, was highly avid for glucose in CON and DEX mothers but accumulated significantly less FDG in INS mothers (Fig. 3F).
Figure 3.
FDG content vs. time. A and C–F, SUVPET for the indicated volumes of interest. B, Serum 18F concentration. Groups: CON (gray circle, dotted line), DEX (white diamond), and INS (black square, bold line). +, P < 0.01 for difference vs. CON; ×, P < 0.01 for difference vs. DEX; *, P < 0.01 for difference vs. CON and DEX by ANOVA and Tukey’s HSD (n = 6–10 mothers per group).
Final glucose disposition
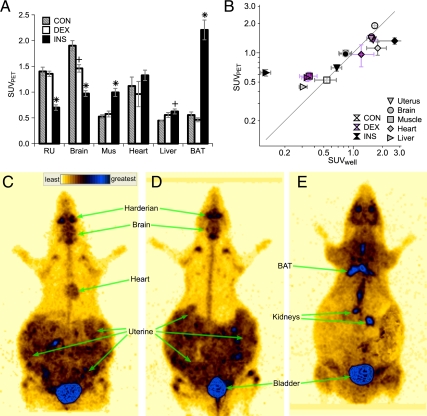
The FDG distribution at 90–120 min was determined by whole-body PET imaging (Fig. 4). In CON mothers, the highest degree of FDG accumulation occurred in brain followed by the right-uterine region (consisting primarily of fetuses and placentae), then heart (Fig. 4A). Low amounts of FDG accumulation occurred in skeletal muscle, liver, and brown adipose tissue (BAT). DEX mothers exhibited FDG accumulation similar to CON with the exception of a reduction in brain FDG accumulation. By contrast, INS mothers exhibited multiple differences in FDG accumulation. In INS compared with CON, FDG was significantly increased in skeletal muscle and BAT but significantly decreased in brain and the right-uterine structures.
Figure 4.
Final FDG disposition at the conclusion of PET imaging. A, SUVPET in indicated tissues in CON (gray stripe), DEX (white), and INS (black) groups. RU, Right uterine structures; Mus, skeletal muscle. +, ×, and *, P < 0.05 for difference vs. CON, DEX, and both, respectively, by ANOVA and Tukey’s HSD (n = 6–10 mothers per group). B, Correlation of SUVPET (y-axis) and SUVwell (x-axis). Tissues (right uterus, inverted triangle; brain, circle; muscle, square; heart, diamond; and liver, sideways triangle) and experimental groups (CON, white; DEX, purple; and INS, black symbols). C–E, Representative whole-body PET images for CON (C), DEX (D), and INS (E), highlighting regions of strong uptake. Heart is not distinctly visible and thus not labeled, in D and E; likewise for BAT in C and D. Regions directly exposed to FDG infusate, as defined on early frames, are masked.
As an independent measure of FDG accumulation, tissue 18F was quantified by well-counting of tissues excised after euthanasia at 160 min. In general, there was a high degree of correlation between these two approaches (Fig. 4B). However, PET overestimated liver FDG content, especially in INS mothers, likely due to difficulty in distinguishing liver from nearby tissues, such as diaphragm on the PET images. Thus, the apparent increase in liver SUVPET among INS mothers was likely artifactual and not truly increased.
The marked difference in FDG disposition induced in INS mothers was readily visualized in whole-body PET images (Fig. 4, C–E). For example, the increased FDG content of BAT and limb girdle skeletal muscles of INS mothers was apparent. Conversely, the brain and right-uterine horn in INS animals were indistinct with relatively low FDG content, contrasting to the relatively intense FDG content in these regions in CON and DEX animals.
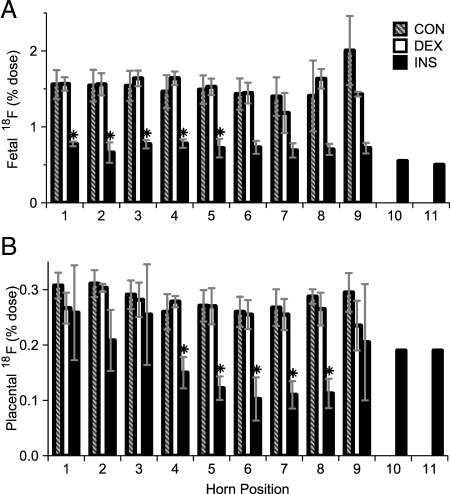
The uterine horn regions contain fetuses, placentae, and the uterus, which could not be readily distinguished from each other on the PET images. We thus determined the FDG content of each right-uterine fetus and placenta by well-counting (Fig. 5). CON and DEX fetuses displayed considerable avidity for FDG, accumulating approximately 1.5% of the total FDG dose per fetus (Fig. 5A). Consistent with the changes observed by PET in the whole right-uterine horn, FDG accumulation was significantly reduced in INS fetuses compared with CON and DEX fetuses (Fig. 5A). Likewise, placental FDG was reduced in INS compared with CON and DEX placentae (Fig. 5B), although not to as great or consistent an extent as occurred in the fetuses.
Figure 5.
Right uterine fetal and placental glucose uptake. FDG content at the conclusion of imaging, as determined by well-counting of individual fetuses (A) and placentae (B). Results for CON (striped), DEX (white), and INS (black) groups are expressed by horn position, with that closest to the uterine cervix counted as position 1 and incrementing toward the ovary. *, P < 0.05 for difference vs. CON and DEX by ANOVA and Tukey’s HSD (n = 6–11 mothers per group).
Glucose accumulation kinetics
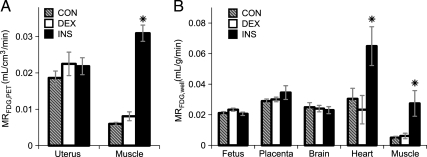
Comparing between the three conditions, tissues did not experience equal exposure to FDG due to differences in the serum FDG concentration curves (Fig. 3B). Indeed, the serum FDG concentration areas under the curve were 2.1 ± 0.3 (P < 0.05, n = 6–9 mothers) and 2.6 ± 0.2 (P < 0.005, n = 6–9 mothers) fold higher in CON and DEX compared with INS mothers. Thus tissue FDG accumulation, measured as SUV or % dose, was unlikely to represent the relative glucose avidities between conditions. To better investigate the relative avidity of structures for FDG uptake and metabolism, two well-established kinetic analysis approaches that take into account the serum FDG concentration curves were used. Specifically, we determined two independent measures of the FDG metabolic rate: 1) MRFDG,PET, based on PET data and Patlak analysis (20), and 2) MRFDG,well, based on well-counter data and calculation of the fractional uptake rate (21). Both of these approaches account for relative serum glucose concentrations during the scan. This is important, because serum glucose differed between the three conditions (Fig. 1C). The rates derived from our data for the two approaches showed good agreement (Fig. 6). In skeletal muscle, MRFDG,PET and MRFDG,well were both dramatically increased in INS compared with CON and DEX mothers (Fig. 6, A and B). Likewise, in heart MRFDG,well was increased for INS mothers. By contrast, for the right-uterine region, MRFDG,PET was statistically unchanged between the three conditions. Similarly, MRFDG,well was statistically unchanged between conditions for both right-sided placenta and fetuses. Likewise, for maternal brain, no significant differences between groups for MRFDG,well were observed.
Figure 6.
Avidity of tissues for FDG. A, MRFDG,PET determined from dynamic PET imaging for the right-uterine region and skeletal muscle. B, MRFDG,well was determined from 18F well-counts and serum 18F concentration area under the curve. CON (gray stripe), DEX (white), and INS (black) groups. *, P < 0.05 for difference vs. CON and DEX by ANOVA and Tukey’s HSD (n = 6–11 mothers per group).
Discussion
Placenta and fetus during late gestation have a high degree of avidity for glucose at baseline. Because the combined mass of late gestational placentae and fetuses is large, together, they represent a considerable metabolic burden on the mother. We find that PET imaging using FDG is an ideal means to assess glucose transport simultaneously into maternal tissues and fetus/placenta in the pregnant rat. At baseline, FDG accumulation into fetuses rivals that of maternal brain and is higher than that of heart, skeletal muscle, liver, and BAT. The SUV values for FDG that we observed in the rat fetus and maternal brain are similar to that reported in pregnant macaque monkeys, at 1.95 and 1.58 for the maternal and fetal brain, respectively (26). That FDG accumulation is similar between fetus and maternal brain has also previously been observed in rats with fetus and placenta at 0.61 and 0.95% dose/g, respectively, compared with 0.7 for maternal brain (27).
Insulin, as our study illustrates and quantifies, has a marked effect on glucose disposition in the pregnant rat. Insulin decreased the relative amounts of FDG, a glucose analog, accumulating in the fetus, with a similar effect in the maternal brain as well. This effect was due to the accelerated clearance of FDG from the maternal circulation, related to stimulation of FDG transport into insulin-sensitive maternal tissues, such as skeletal muscle and BAT. Interestingly, brain and placental tissue both are dependent upon the same two GLUT isoforms, GLUT1 and GLUT3 (3,9,10), for glucose uptake. GLUT1 and GLUT3 are not insulin responsive. It is thus not surprising that brain and fetus experienced similar degrees of FDG accumulation, both at baseline and in response to whole-body insulin action. Our kinetic analysis shows that insulin does not increase the inherent avidity of the placental:fetal unit for glucose, showing that the primary mechanism by which insulin decreases FDG accumulation in the fetus is by increasing the clearance rate of FDG into insulin-sensitive maternal tissues.
Consistent with prior studies (25), we found that DEX restricts fetal growth. However, it is unlikely that this growth restriction is due to an alteration in maternal, placental, or fetal glucose transport. We found that DEX has little effect on FDG disposition in maternal tissues, placentae, or fetuses compared with the baseline (fasting) state. Likewise, our kinetic analysis indicates that DEX has little effect on the avidity of glucose transport by placentae. These conclusions are similar to that observed in ex vivo placental villous fragments from humans (28) or ex vivo perfused placenta from guinea pig (29), where short-term glucocorticoids have no effect on glucose transport. However, to our knowledge, our study appears to be the first to address this question in vivo, because we and others (8) have found no reports of the in vivo effects of glucocorticoids on placental glucose transport.
FDG is well known to be transported across the placenta to the fetus, in rodents and humans (27,30). The net FDG transport measured for placenta thus underestimates the total FDG uptake into the placenta, because a significant quantity of FDG is taken into placenta transiently only to be transported to the fetus (31). Thus, the actual total FDG uptake rate for placenta is undoubtedly quite high. One caveat to the use of FDG as a measure of glucose transport from the mother to fetus is that glucose, as opposed to FDG, can be consumed or produced by the placenta (32). Net placental glucose production or consumption would lead to fetal glucose exposures differing from that predicted by FDG transport. For our study, it is thus of interest whether DEX or insulin alter placenta consumption or production of glucose. There is evidence of increased placental glucose consumption occurring in response to glucocorticoid (33). Thus, we cannot rule out the possibility that this mechanism may lead to a decrease in fetal glucose exposure despite the unaltered FDG transport. In contrast, evidence suggests that insulin does not alter placental glucose production or consumption late in gestation (29,34,35), although insulin increases placental accumulation of phosphorylated 2-deoxyglucose, a glucose tracer, earlier in gestation (36). Our studies were performed in the fasted state, which importantly is likely similar to the fed state in terms of glucose utilization by the placenta and the whole fetus (37).
Late gestation during normal pregnancy is characterized by increased maternal glucocorticoids, insulin levels, and insulin resistance in both humans (38,39) and rats (40,41,42). Thus, for our studies, we chose high-end doses to augment the already increased levels of these hormones, as might occur in humans during pharmacological use of these agents. Despite the insulin resistance of late gestation, we found that glucose uptake is stimulated in maternal tissues by insulin action, a finding similar to that observed in humans (39). Although our studies were not designed to compare insulin responsiveness during late gestations to other stages of gestation or nonpregnancy, our studies do advance the field regarding insulin action in pregnancy by adding real-time assessment of glucose uptake simultaneously across the fetuses and multiple maternal organs. Additionally, our studies provide strong and quantitative confirmation that insulin does not directly affect glucose transport in placental-fetal unit.
Our results highlight the tremendous competition between mother and fetuses for glucose. In the baseline fasted state, the fetuses and placentae are a major consumer of glucose, perhaps accounting for more glucose uptake than any single maternal organ. This places a significant metabolic strain on the mother, requiring maternal adaptation. Insulin reverses the situation, increasing the glucose transport avidity of skeletal muscle, brown fat, and heart but not of the placenta or fetus. Because placental and fetal uptake avidity is maintained, the fetus is likely not at risk for glycopenia as long as maternal euglycemia is maintained. However, the fetus has no protection against maternal hypoglycemia induced by excess insulin and is at risk for significant glycopenia under such circumstances.
In summary, transport of glucose to placenta and fetus is high in the fasted state compared with most maternal tissues. DEX has no discernible effect on maternal, fetal, or placenta glucose transport. Thus we conclude that the reduction of fetal growth by DEX is likely not due to an effect on glucose transport avidity of the placenta and fetus. Maternal-sided insulin action does not alter the avidity of the fetus and placenta for glucose transport. However, insulin indirectly decreases the effective competitiveness of fetus/placenta for maternal glucose by increasing the avidity of selected maternal tissues for glucose. Finally, this work highlights that PET imaging is an excellent means to simultaneously quantify the transport of glucose tracer into both maternal and fetal tissues.
Supplementary Material
Acknowledgments
We thank PET technologists Dean A. Clermont, C.N.M.T., Christine A. Mundt, C.N.M.T., John C.W. Richmond, C.N.M.T., and Julie A. Riggert, M.A., C.N.M.T. We also thank Gordon L. Watkins, Ph.D., and Katherine R. Thede-Reynolds, M.S., for preparation of the radiolabeled FDG. All acknowledged are from the University of Iowa, Department of Radiology.
Footnotes
This work was supported by American Diabetes Association’s Amaranth Diabetes Fund 1-08-RA-142 (to A.W.N.), the National Institutes of Health (NIH) Grant R01-DK081548 (to A.W.N.), the Burlington Care for Kids fund, and the NIH Grant P30 CA086862 (cancer center support grant for the University of Iowa Small Animal Imaging Core).
Disclosure Summary: The authors have nothing to disclose.
Abbreviations: BAT, Brown adipose tissue; CON, control; DEX, dexamethasone; FDG, [18F]fluorodeoxyglucose; GLUT, glucose transporter; HSD, honestly significant difference; INS, insulin receiving; MRFDG,PET, FDG metabolic rate based on PET; MRFDG,well, metabolic rate based on well-counter; n.s., not significant; PET, positron emission tomography; SUV, standardized uptake values; SUVPET, SUV based on PET; SUVwell, SUV based on well-counter; VOI, volume-of-interest.
First Published Online November 17, 2010
References
- Freinkel N, Lewis NJ, Akazawa S, Roth SI, Gorman L 1984 The honeybee syndrome—implications of the teratogenicity of mannose in rat-embryo culture. N Engl J Med 310:223–230 [DOI] [PubMed] [Google Scholar]
- Hay WWJ 2006 Recent observations on the regulation of fetal metabolism by glucose. J Physiol 572:17–24 [DOI] [PMC free article] [PubMed] [Google Scholar]
- Ganguly A, McKnight RA, Raychaudhuri S, Shin B, Ma Z, Moley K, Devaskar SU 2007 Glucose transporter isoform-3 mutations cause early pregnancy loss and fetal growth restriction. Am J Physiol Endocrinol Metab 292:E1241–E1255 [DOI] [PubMed] [Google Scholar]
- Weindling M 2009 Offspring of diabetic pregnancy: short-term outcomes. Semin Fetal Neonatal Med 14:111–118 [DOI] [PubMed] [Google Scholar]
- Dabelea D, Hanson RL, Lindsay RS, Pettitt DJ, Imperatore G, Gabir MM, Roumain J, Bennett PH, Knowler WC 2000 Intrauterine exposure to diabetes conveys risks for type 2 diabetes and obesity: a study of discordant sibships. Diabetes 49:2208–2211 [DOI] [PubMed] [Google Scholar]
- Zamudio S, Torricos T, Fik E, Oyala M, Echalar L, Pullockaran J, Tutino E, Martin B, Belliappa S, Balanza E, Illsley NP 2010 Hypoglycemia and the origin of hypoxia-induced reduction in human fetal growth. PLoS One 5:e8551 [DOI] [PMC free article] [PubMed] [Google Scholar]
- ter Braak EWMT, Evers IM, Willem Erkelens D, Visser GHA 2002 Maternal hypoglycemia during pregnancy in type 1 diabetes: maternal and fetal consequences. Diabetes Metab Res Rev 18:96–105 [DOI] [PubMed] [Google Scholar]
- Jones HN, Powell TL, Jansson T 2007 Regulation of placental nutrient transport—a review. Placenta 28:763–774 [DOI] [PubMed] [Google Scholar]
- Simpson IA, Carruthers A, Vannucci SJ 2007 Supply and demand in cerebral energy metabolism: the role of nutrient transporters. J Cereb Blood Flow Metab 27:1766–1791 [DOI] [PMC free article] [PubMed] [Google Scholar]
- Carruthers A, Dezutter J, Ganguly A, Devaskar SU 2009 Will the original glucose transporter isoform please stand up! Am J Physiol Endocrinol Metab 297:E836–E848 [DOI] [PMC free article] [PubMed] [Google Scholar]
- Bloom SL, Sheffield JS, McIntire DD, Leveno KJ 2001 Antenatal dexamethasone and decreased birth weight. Obstet Gynecol 97:485–490 [DOI] [PubMed] [Google Scholar]
- Costedoat-Chalumeau N, Amoura Z, Le Thi Hong D, Wechsler B, Vauthier D, Ghillani P, Papo T, Fain O, Musset L, Piette J 2003 Questions about dexamethasone use for the prevention of anti-SSA related congenital heart block. Ann Rheum Dis 62:1010–1012 [DOI] [PMC free article] [PubMed] [Google Scholar]
- French NP, Hagan R, Evans SF, Godfrey M, Newnham JP 1999 Repeated antenatal corticosteroids: size at birth and subsequent development. Am J Obstet Gynecol 180:114–121 [DOI] [PubMed] [Google Scholar]
- Reinisch JM, Simon NG, Karow WG, Gandelman R 1978 Prenatal exposure to prednisone in humans and animals retards intrauterine growth. Science 202:436–438 [DOI] [PubMed] [Google Scholar]
- Ahmad I, Beharry KDA, Valencia AM, Cho S, Guajardo L, Nageotte MP, Modanlou HD 2006 Influence of a single course of antenatal betamethasone on the maternal-fetal insulin-IGF-GH axis in singleton pregnancies. Growth Horm IGF Res 16:267–275 [DOI] [PubMed] [Google Scholar]
- Schumacher A, Sidor J, Bühling KJ 2006 Continuous glucose monitoring using the glucose sensor CGMS in metabolically normal pregnant women during betamethasone therapy for fetal respiratory distress syndrom. Z Geburtshilfe Neonatol 210:184–190 [DOI] [PubMed] [Google Scholar]
- Langdown ML, Sugden MC 2001 Enhanced placental GLUT1 and GLUT3 expression in dexamethasone-induced fetal growth retardation. Mol Cell Endocrinol 185:109–117 [DOI] [PubMed] [Google Scholar]
- Yao J, Wang C, Walsh SA, Hu S, Sawatzke AB, Dang D, Segar JL, Ponto LLB, Sunderland JJ, Norris AW 2010 Localized fetomaternal hyperglycemia: spatial and kinetic definition by positron emission tomography. PLoS One 5:e12027 [DOI] [PMC free article] [PubMed] [Google Scholar]
- Bechtold AG, Vernon K, Hines T, Scheuer DA 2008 Genetic predisposition to hypertension sensitizes borderline hypertensive rats to the hypertensive effects of prenatal glucocorticoid exposure. J Physiol 586:673–684 [DOI] [PMC free article] [PubMed] [Google Scholar]
- Patlak CS, Blasberg RG, Fenstermacher JD 1983 Graphical evaluation of blood-to-brain transfer constants from multiple-time uptake data. J Cereb Blood Flow Metab 3:1–7 [DOI] [PubMed] [Google Scholar]
- Thie JA 1995 Clarification of a fractional uptake concept. J Nucl Med 36:711–712 [PubMed] [Google Scholar]
- Dunn JT, Anthony K, Amiel SA, Marsden PK 2009 Correction for the effect of rising plasma glucose levels on quantification of MR(glc) with FDG-PET. J Cereb Blood Flow Metab 29:1059–1067 [DOI] [PubMed] [Google Scholar]
- Lindholm P, Minn H, Leskinen-Kallio S, Bergman J, Ruotsalainen U, Joensuu H 1993 Influence of the blood glucose concentration on FDG uptake in cancer—a PET study. J Nucl Med 34:1–6 [PubMed] [Google Scholar]
- Wiebold JL, Becker WC 1987 Inequality in function of the right and left ovaries and uterine horns of the mouse. J Reprod Fertil 79:125–134 [DOI] [PubMed] [Google Scholar]
- Roghair RD, Segar JL, Kilpatrick RA, Segar EM, Scholz TD, Lamb FS 2007 Murine aortic reactivity is programmed equally by maternal low protein diet or late gestation dexamethasone. J Matern Fetal Neonatal Med 20:833–841 [DOI] [PubMed] [Google Scholar]
- Benveniste H, Fowler JS, Rooney WD, Moller DH, Backus WW, Warner DA, Carter P, King P, Scharf B, Alexoff DA, Ma Y, Vaska P, Schlyer D, Volkow ND, 2003 Maternal-fetal in vivo imaging: a combined PET and MRI study. J Nucl Med 44:1522–1530 [PubMed] [Google Scholar]
- Ishiwata K, Ido T, Kawashima K, Yamada H, Takahashi T, Iwata R, Matsui A, Sakuragawa N 1985 Placental transfer of positron-emitting radionuclides in metabolic substrates. Int J Nucl Med Biol 12:33–36 [DOI] [PubMed] [Google Scholar]
- Ericsson A, Hamark B, Jansson N, Johansson BR, Powell TL, Jansson T 2005 Hormonal regulation of glucose and system a amino acid transport in first trimester placental villous fragments. Am J Physiol Regul Integr Comp Physiol 288:R656–R662 [DOI] [PubMed] [Google Scholar]
- Wheeler PD, Yudilevich DL 1989 Effect of insulin, prostaglandin E1 and uptake inhibitors on glucose transport in the perfused guinea-pig placenta. J Dev Physiol 11:159–169 [PubMed] [Google Scholar]
- Zanotti-Fregonara P, Jan S, Champion C, Trébossen R, Maroy R, Devaux J, Hindié E 2009 In vivo quantification of 18F-FDG uptake in human placenta during early pregnancy. Health Phys 97:82–85 [DOI] [PubMed] [Google Scholar]
- Hauguel-de Mouzon S, Shafrir E 2001 Carbohydrate and fat metabolism and related hormonal regulation in normal and diabetic placenta. Placenta 22:619–627 [DOI] [PubMed] [Google Scholar]
- Leonce J, Brockton N, Robinson S, Venkatesan S, Bannister P, Raman V, Murphy K, Parker K, Pavitt D, Teoh TG, Regan L, Burchell A, Steer P, Johnston DG 2006 Glucose production in the human placenta. Placenta 27(Suppl A):S103–S108 [DOI] [PubMed] [Google Scholar]
- Ward JW, Wooding FBP, Fowden AL 2004 Ovine feto-placental metabolism. J Physiol 554:529–541 [DOI] [PMC free article] [PubMed] [Google Scholar]
- Urbach J, Mor L, Ronen N, Brandes JM 1989 Does insulin affect placental glucose metabolism and transfer? Am J Obstet Gynecol 161:953–959 [DOI] [PubMed] [Google Scholar]
- Challier JC, Hauguel S, Desmaizieres V 1986 Effect of insulin on glucose uptake and metabolism in the human placenta. J Clin Endocrinol Metab 62:803–807 [DOI] [PubMed] [Google Scholar]
- Leturque A, Hauguel S, Kande J, Girard J 1987 Glucose utilization by the placenta of anesthetized rats: effect of insulin, glucose, and ketone bodies. Pediatr Res 22:483–487 [DOI] [PubMed] [Google Scholar]
- Haugel S, Leturque A, Gilbert M, Kande J, Girard J 1988 Glucose utilization by the placenta and fetal tissues in fed and fasted pregnant rabbits. Pediatr Res 23:480–483 [DOI] [PubMed] [Google Scholar]
- Damjanovic SS, Stojic RV, Lalic NM, Jotic AZ, Macut DP, Ognjanovic SI, Petakov MS, Popovic BM 2009 Relationship between basal metabolic rate and cortisol secretion throughout pregnancy. Endocrine 35:262–268 [DOI] [PubMed] [Google Scholar]
- Catalano PM, Tyzbir ED, Wolfe RR, Calles J, Roman NM, Amini SB, Sims EA 1993 Carbohydrate metabolism during pregnancy in control subjects and women with gestational diabetes. Am J Physiol 264:E60–E67 [DOI] [PubMed] [Google Scholar]
- Dupouy JP, Coffigny H, Magre S 1975 Maternal and foetal corticosterone levels during late pregnancy in rats. J Endocrinol 65:347–352 [DOI] [PubMed] [Google Scholar]
- Herrera E, Knopp RH, Freinkel N 1969 Carbohydrate metabolism in pregnancy. VI. Plasma fuels, insulin, liver composition, gluconeogenesis, and nitrogen metabolism during late gestation in the fed and fasted rat. J Clin Invest 48:2260–2272 [DOI] [PMC free article] [PubMed] [Google Scholar]
- Leturque A, Ferré P, Satabin P, Kervran A, Girard J 1980 In vivo insulin resistance during pregnancy in the rat. Diabetologia 19:521–528 [DOI] [PubMed] [Google Scholar]
Associated Data
This section collects any data citations, data availability statements, or supplementary materials included in this article.


