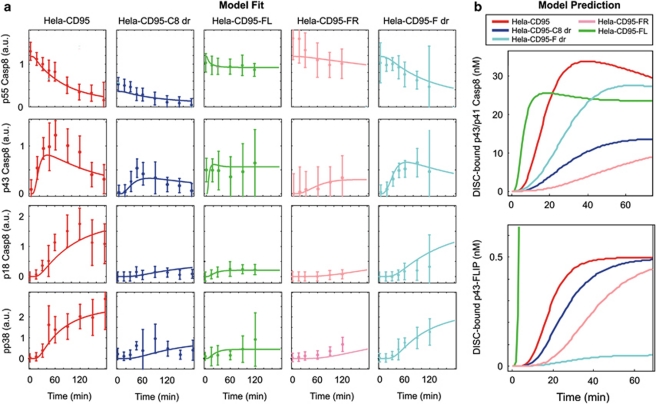
Figure 6.
The best-fit model captures time courses of caspase-8/MAPK activation and predicts the dynamics of DISC formation. (a) Model fits to experimental measurements of p55/p53 procaspase-8, caspase-8 cleavage products p43/p41 and p18, as well as phospho-p38 (pp38) in response to stimulation with 1000 ng/ml anti-APO-1. Each column corresponds to measurements in one of the HeLa-CD95 cell lines (indicated on top), and each row corresponds to one molecular species (indicated on the left). All kinetic parameters of the model (except the ligand concentration and the ligand binding rate) were fitted globally to measurements in anti-APO-1 and CD95L-stimulated HeLa-CD95 cells (see Supplementary information for kinetic parameters and fits to CD95L data). (b) Predicted dynamics of p43/p41 and p43-FLIP recruitment to the DISC in response to stimulation with 1000 ng/ml anti-APO-1. Each color corresponds to one of the HeLa-CD95 cell lines as indicated in the legend

