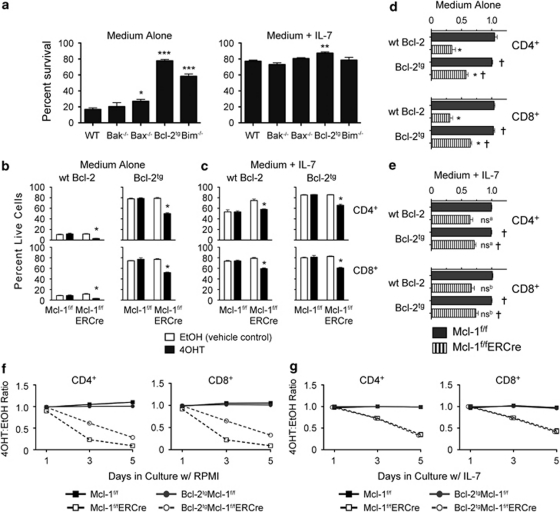
Figure 3.
Overexpression of Bcl-2 rescues cells from cytokine dependence but not dependence on Mcl-1. (a) Percent survival by PI exclusion of wild type (WT), Bak−/−, Bax−/−, Bcl-2tg, and Bim−/− T cells in culture of total splenocytes with or without IL-7 for 3 days. *P<0.05, **P<0.01, ***P<0.001 versus WT control. Items not marked with an asterisk are not significant (P≥0.05). (b and c) Percent surviving cells by PI exclusion after 3-day culture of total splenocytes without (b) and with (c) IL-7. Cells overexpressing Bcl-2 (Bcl-2tg) and cells expressing only endogenous Bcl-2 (wt Bcl-2) are shown. The y-axis scale is the same for the wt Bcl-2 and adjacent Bcl-2tg graphs. Bars are mean+S.D. of triplicate wells from a single experiment. Data are representative of four independent experiments. *P<0.05 versus EtOH control within each genotype. (d and e) Survival ratios of wt Bcl-2 and Bcl-2tg cells upon 3-day culture in medium alone (d) or in IL-7 (e). Bars are the mean+S.E.M. of 4–6 independent experiments. *P<0.05 between the ERCre+ samples. †P<0.05 between ERCre+ and ERCreneg samples within the Bcl-2tg genotype. Here, ns indicates that P≥0.05 between the indicated samples (designated by lower-case letters). (f and g) Time course of survival of wt Bcl-2 and Bcl-2tg, Mcl-1f/f, and Mcl-1f/fERCre T cells in RPMI alone (f) or with IL-7 (g). The mean of the 4OHT/EtOH survival ratios from 1–3 experiments is plotted versus time

