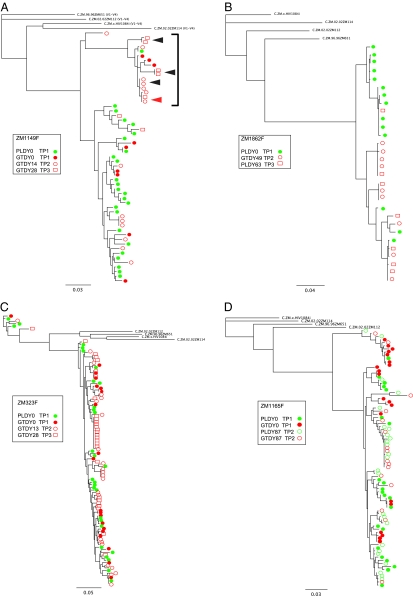
Fig. 3.
Phylogenetic analysis of longitudinal samples. Longitudinal sequences (V1–V4) from chronically infected females, blood PL and GT, were aligned, and ML phylogenetic trees were drawn for chronically infected female subjects ZM1149F (A), ZM1862F (B), ZM323F (C), and ZM1165F (D). Blood-derived sequences are shown in green, and GT-derived sequences are shown in red. Closed arrowheads in A identify identical or nearly identical sequences from both the same time points [GTDY28 time point 3 (TP3)], and open arrowheads identify identical or nearly identical sequences from different time points [GTDY14 time point 2 (TP2) and GTDY28 time point 3 (TP3)]. Four Zambian subtype C reference sequences were used to root the tree. Horizontal branch lengths are drawn to the scale shown.

