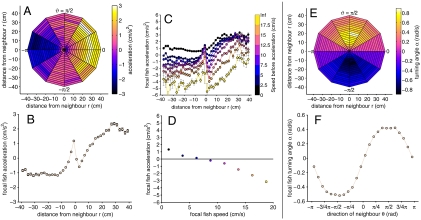
Fig. 2.
(A) Acceleration of the focal fish vs. distance (r) and position (ϑ) of the neighbors. (In these plots, the focal fish is located at the origin and faces to the right.) (B) Acceleration of the focal fish vs. distance of the neighbors. Positive or negative x-axis values indicate the neighbor was respectively in front of or behind the focal fish. (C) Same plot as in B, but each curve corresponds to a different speed of the focal fish immediately before the acceleration response. (D) Average acceleration of the focal fish vs. own current speed. (E) Average turning angle of the focal fish as a function of distance and position of all neighbors. Negative values indicate a right turn, positive values indicate a left turn. (F) Average turning angle as a function of the position of the neighbor (ϑ). Data are calculated using the position of all neighbors; error bars (often smaller than symbol size) represent standard errors.

