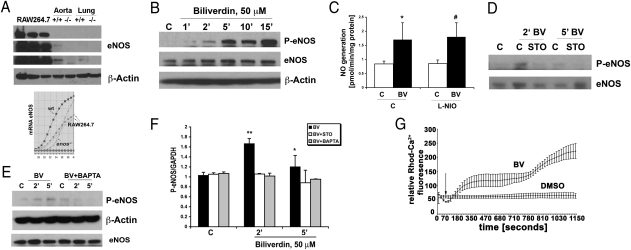
Fig. 1.
BV induces phosphorylation of eNOS dependent on Ca2+/CaMKK. (A) Representative immunoblot (Upper) and PCR profile (Lower) with antibodies or primers against eNOS in RAW 264.7 Mφ and tissues (aorta and lung shown as positive controls) harvested from Enos+/+ and Enos−/− mice. β-Actin was used as a loading control. One of three independent experiments is shown. Different exposure times of the membrane are shown because of differences in the amounts of eNOS present in tissues vs. cells. (B) Immunoblot against phosphorylated eNOS (Ser-1177) in RAW 264.7 Mφ treated with DMSO (C) or biliverdin (BV; 50 μM) over time. eNOS and β-actin were used as loading controls. Data are representative of three independent experiments. (C) NO generation was measured in RAW 264.7 Mφ treated with L-NIO (100 μM) 30 min before BV (50 μM). NO was measured starting 10 min after BV for 30 min. Data represent mean ± SD from three repeated measurements. P < 0.05. (D) Immunoblot of phospho-eNOS (Ser1177) measured at the indicated times in the presence and absence of the CaMKK inhibitor STO-609 (1 μg/mL) applied to RAW 264.7 Mφ 1 h before DMSO or BV (50 μM). The blot is representative of three independent experiments. (E) Immunoblot of P-eNOS (Ser1177) in RAW 264.7 Mφ pretreated with the calcium chelator BAPTA for 1 h before addition of BV for the indicated times. Data are representative of three independent experiments. (F) Densitometric analyses of P-eNOS/GAPDH of blots in D and E. Results represent mean ± SD of three independent experiments. *P < 0.05 BV5′ vs. control; **P < 0.01 BV2′ vs. control. (G) Time-lapse studies of calcium influx were measured in RAW 264.7 Mφ treated with BV (50 μM). Fluorescence intensity was measured every 20 s. Arrow indicates the addition of DMSO or BV. Results represent mean ± SD of two independent experiments.

