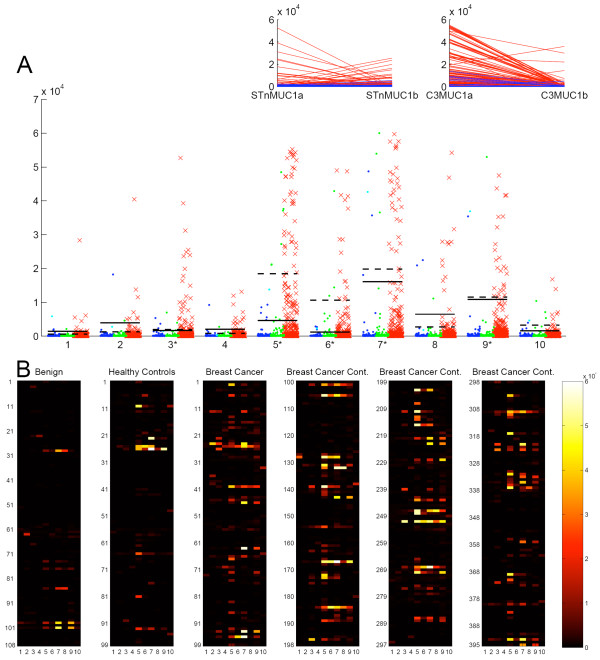
Figure 3.
Reactivity of auto-antibodies in sera with MUC1 glycoforms. A, dot blot showing the reactivity of auto-antibodies present in sera from breast cancer patients, red crosses; patients with benign breast disease, blue circles; and healthy females aged ranged matched to the cancer patients, green circles. Bars indicate the position for 2x the standard deviation of the mean of the benign serum values, (solid bar) or the aged matched normal values, (dotted bar). Glycopeptides are defined in figure 1B. Inserts show the reactivity of autoantibodies in the sera of breast cancer patients with MUC1a and b carrying STn (left insert) and MUC1a and b carrying core3 (right insert). Each red line represents an individual serum sample. B, heat maps of the reactivity of autoantibodies in sera to glycopeptides 1 to 10 defined in figure 1B. Breast Cancer Cont, breast cancer sera continued.

