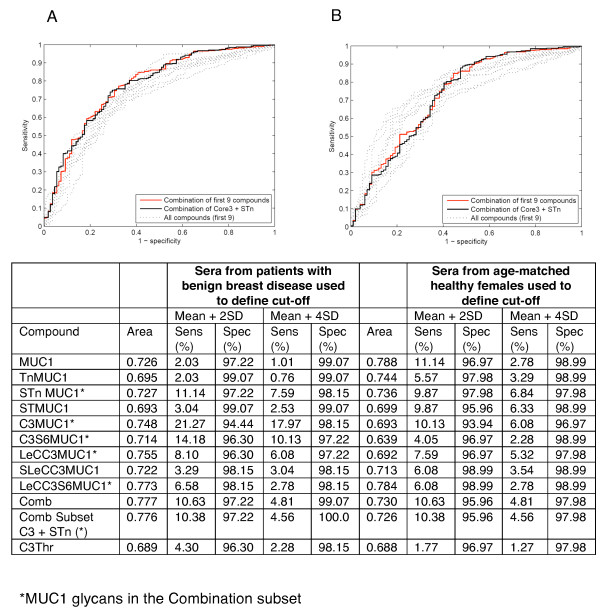
Figure 4.
Receiver operating characteristic analysis of individual and combinations of features. A, sera from patients with benign breast disease defines cut-offs; B, sera from healthy females defines cut-offs. Pale dotted grey lines represent individual features, solid red line represent the combination of all the features and solid black line represents the combinational subset defined in Table by * and Figure 1B by *. The table shows ROC curve area and sensitivity/specificity data for breast cancer sera on each MUC1 glycan, combination of all MUC1 glycans and a combination subset.

