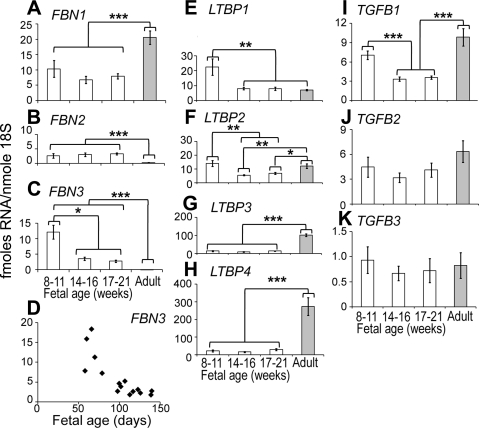
Figure 1.
Expression levels of FBN1 (A), FBN2 (B), FBN3 (C, D), LTBP1 (E), LTBP2 (F), LTBP3 (G), LTBP4 (H), TGFB1 (I), TGFB2 (J), and TGFB3 (K) mRNA in whole fetal human ovary and adult tunica/cortical stroma. A–C, E–K) Data are means ± se (fmol/nmol 18S ribosomal RNA). For analysis, samples were grouped into 3 estimated gestational stages: first trimester (8–11 wk; germ cell proliferation), early second trimester (14–16 wk; some initiation of meiosis), and late second trimester (17–21 wk; widespread meiosis, follicle formation); n = 5–6/group. Data were analyzed by 1-way ANOVA with post hoc Tukey's test. Data for FBN2, FBN3, LTBP1, and LTBP2 were log transformed before analyses. *P < 0.05, **P < 0.01, ***P < 0.001, significant differences. D) Scatter plot of FBN3 expression vs. estimated gestational age.

