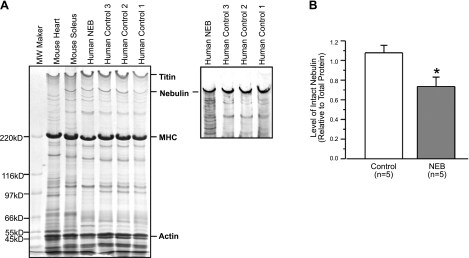
Figure 7.
Electrophoretic and Western blot analysis of nebulin. A) Gradient (2–12%) SDS-PAGE gel shows lower level of nebulin in the patient muscle (NEB) as compared with 3 control samples. Western blot detected multiple degradation bands of nebulin in the patient muscle sample. B) Densitometry quantification of the SDS-gel using Scion Image software was performed for 1 patient muscle and 3 control muscle samples with 3 duplicated SDS gels. Level of intact nebulin relative to total protein was significantly lower in the patient sample as compared with the controls. While the present study reports the first case of the nebulin mutation, multiple runs of the SDS gel and Western blot were examined by densitometry to validate the technical reliability of nebulin quantification. Values are shown as means ± se. *P < 0.05 vs. control.

