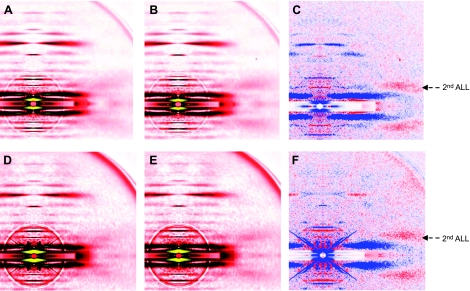
Figure 9.
X-ray diffraction patterns from human controls (A–C) and from the patient (D–F) show overstretched fibers (> 3.60 μm), in low-EGTA rigor (A, D) and calcium-rigor (B, E) solutions. Differences in intensity profiles (C, F) show enhanced (red) and weakened (blue) areas after calcium addition.

