

Abstract
We present a comparative study of xanthorhodopsin, a proton pump with the carotenoid salinixanthin serving as an antenna, and the closely related bacteriorhodopsin. Upon excitation of retinal, xanthorhodopsin exhibits a wavy transient absorption pattern in the region between 470 and 540 nm. We interpret this signal as due to electrochromic effect of the transient electric field of excited retinal on salinixanthin. The spectral shift decreases during the retinal dynamics through the ultrafast part of the photocycle. Differences in dynamics of bacteriorhodopsin and xanthorhodopsin are discussed.
Introduction
Xanthorhodopsin (XR) is a light-activated proton pump found in an extremely halophilic bacterium Salinibacterruber[1]. Related to the archaeal bacteriorhodopsin (BR) and even more to the bacterial proteorhodopsin[2], XR also contains retinal as a chromophore whose all-trans to 13-cis photoisomerization triggers conformational changes in the protein, finally leading to proton translocation across the membrane. Unlike most proton pumps studied so far, XR non-covalently binds a caroteneoid, salinixanthin (SX), serving as an antenna. The crystal structure of XR, at 1.9 Å resolution[2], reveals an 11.7 Å centre-to-centre distance between SX and the retinal. The angle between the conjugated systems of the two chromophores is 46°, providing an arrangement suitable for efficient energy transfer. Indeed, SX-to-retinal energy transfer occurs with an efficiency of 40% as demonstrated by action spectra for oxygen uptake in respiring cells [1], fluorescence excitation spectra in XR-containing cell membranes [3], and by direct measurements of energy transfer by femtosecond transient absorption [4]. Thus, the single carotenoid serving as a light-harvesting pigment makes XR the simplest known antenna system.
Energy transfer between SX and retinal occurs exclusively from the S2 state because the dark S1 state lies significantly below the acceptor state of retinal[4]. Comparison of the S2 lifetimes of SX in NaBH4-treated XR, which has unperturbed SX binding site, but prevents SX-to-retinal energy transfer[3], allowed to determine the energy transfer rate. The S2 lifetime of 110 fs observed in NaBH4-treated XR was shortened to 66 fs in untreated XR, leading to a calculated energy transfer time of 165 fs and an energy transfer efficiency of 40% [4]. The obtained energy transfer rate corresponded to a Coulombic interaction between SX and retinal of about 200 cm-1, which is comparable to other antenna systems employing the carotenoid S2 state as energy donor [6]. Moreover, this value of SX-retinal interaction was reproduced by transition density cube calculations based on the XR structure [7]. Recent time-resolved experiments using sub-20-fs pulses indicated that the S2 lifetime of SX in XR could be even shorter [5], challenging the nature of SX-retinal interaction. Therefore, it is important to use different approaches to obtain information about interaction between the two pigments in XR.
The ultrafast part of the BR photocycle is described by four states, H-I-J-K. H is the initial excited state in the Franck-Condon region, the H-I process (<200 fs) reflects a skeletal change corresponding to a large twisting about the C13-C14 bond of retinal [8], while I-J is the isomerisation that takes place within ~0.5 ps [9], followed by vibrational relaxation of the J-intermediate, forming the K-state within ~3 ps[11].
Here we present a study of XR and BR after direct excitation of the retinal chromophore, aiming for better understanding the SX-retinal interaction, and a comparison of BR and XR initial dynamics. We make use of the electrochromic shift of carotenoid absorption bands upon change of an electric field in their surroundings. Contrary to the ‘classical’ version of the experiment using an externally applied electric field, we follow an approach employing excited molecules as sources of electric field changes [13]-. In our case, excited retinal in XR induces the electrochromic shift of SX.
Materials & Methods
Sample preparation
Salinibacter ruber strain M31 was grown in the medium described previously [18]. Cells were collected by centrifugation and exposed to overnight dialysis against water. Cell membranes were then washed in 100 mMNaCl and in distilled water. Finally, membrane fractions containing XR were collected by centrifugation [19]. Purple membranes containing BR were obtained as described previously [20]. pH was adjusted to 7.8 and 8.0 for XR and BR, respectively.
Femtosecond pump-probe spectroscopy
For measurements in the visible region, pulses were obtained from a femtosecond laser system (Integra-I, Quantronix) with a repetition rate of 1 kHz, producing pulses with average energy of ~1.9 mJ/pulse and central wavelength ~785 nm. The output beam was divided into excitation (pump) and probe beams. Pump pulses of desired wavelength were generated in an optical parametric amplifier (TOPAS, Light Conversion), and their intensity was kept below 3.1015 photons.pulse-1.cm-2. A fraction of the amplifier output used to generate probe pulses was sent through computer-controlled delay line and then focused to a 2-mm sapphire plate to produce a white light continuum. Before reaching the sample, the probe was divided into two beams, the former overlapping with the excitation beam in the sample and the latter serving as a reference. The instrument response function was ~130 fs as determined by fitting the instantaneous rise of a bleaching signal from a laser dye. Both beams were then dispersed onto a dual photodiode array detection system (ExciPro, CDP Systems). A rotating quartz cuvette with a 1-mm path length, spinning at a rate ensuring that each pulse hits a fresh sample, was used for all measurements. The mutual orientation of the excitation and probe beams was set to the magic angle (54.7°). Kinetics in the near-IR region were recorded with a low-noise femtosecond transient absorption spectrometer with 40-fs time resolution described in detail earlier [4]. Data from the visible region were fitted globally (DAFit, Pascher Instruments) to a sum of exponentials using a sequential kinetic scheme with increasing lifetimes [21].
Results
Absorption spectra of XR, BR, and SX in n-hexane are compared in Fig. 1. The absorption spectrum of BR consists of a single featureless band due to the retinal chromophore with a maximum at 570 nm, while the spectrum of XR is dominated by SX bands below 550 nm with retinal absorption appearing as a shoulder around 565 nm. The vibrational bands of the S0-S2 transition of SX in XR are well resolved, with maxima at 521 nm (0-0), 486 nm (0-1), 456 nm (0-2), and 428 nm (0-3). The improved resolution of these bands in XR, as compared to SX in solution, results from locking SX in the XR binding site [2], which isolates its keto-ring by rotating it about 82° out of the plane determined by the main conjugated system of SX (Fig. 1). Thus the conformational disorder, which is induced in solution by distribution of dihedral angles of the terminal rings, is significantly reduced for SX in XR.
Figure 1.

Absorption spectra of XR, BR, and SX in n-hexane. BR absorbance was scaled to the absorbance of retinal in XR. Excitation wavelength for time-resolved measurements (580 nm) is indicated by a vertical line. In the bottom part are shown chemical structures of SX (top) and retinal (bottom) bound by a Schiff base linkage to lysine of BR and XR.
Transient absorption spectra of BR and XR for different time delays recorded after excitation at 580nm are shown in Fig. 2. The transient absorption spectrum of BR consists of three distinct spectral features[22]: (1) excited state absorption (ESA) in the blue part of the spectrum (the I state), (2) ground state bleaching (GSB) near 555 nm, and (3) a positive signal around 635 nm that appears at later times and reflects formation of the J and K states. Because of the spectral overlap, the J-K transition is distinguishable only as a shift of the band around 630 nm to the blue with time. The same spectral features are identified also in XR, with an additional wavy pattern modulating the ESA below 545 nm. Since SX is not excited at 580 nm (Fig. 1), these bands cannot be assigned to SX bleaching. Instead, as addressed in detail in Discussion, we explain these bands as due to electrochromic shift of the S0-S2 transition of SX induced by the excited retinal chromophore.
Figure 2.

Transient absorption spectra of BR (panel A) and XR (panel B) following the excitation at 580 nm. Distinct spectral features are indicated by vertical dashed lines – ESA of retinal (477 nm), GSB of retinal (555 nm), and J/K states of retinal (635 nm).
Fig. 3 further addresses differences in the dynamics of BR and XR. It compares kinetics of XR and BR at wavelengths corresponding to ESA (477 nm), GSB (555 nm) and J/K (635 nm) signals. The blue-most part of the ESA signal was chosen to minimize the influence of GSB of retinal. In addition, kinetics recorded in the near-IR region at 900 nm, monitoring decay of retinal stimulated emission (SE) [23], are depicted in Fig. 3D. The qualitative comparison of the kinetics unequivocally demonstrates that while no significant differences are found in the kinetics that monitor the GSB and J/K states, the excited state of retinal decays slower in XR than in BR.
Figure 3.

Kinetics recorded after excitation at 580 nm for XR and BR in spectral regions shown in Fig. 2. Panel D shows the decay of SE of retinal in XR and BR.
Fitting the kinetics of retinal SE in BR at 900 nm yields time constants of 0.4 ps (91%) and 2.1 ps (9%). On the other hand, time constants extracted from SE kinetics of XR are 0.7 (70%) and 3.3 ps (30%), thus the overall decay is slower in XR. Based on number of previous reports, for global fitting of BR data in the visible region we fixed the components to 0.5 (excited-state lifetime) and 3 ps (J-K transition)[24]. The resulting fit provided amplitudes of these components of 92% and 8% at 477 nm (ESA region), respectively, matching the results obtained for decay of SE signal in near-IR. This confirms that the blue-most part of BR transient absorption spectra reflects the decay of the excited state of retinal (the I state). Since the time constants of SE decay of XR are comparable to those of BR (see above), we have used the same time constants of 0.5 and 3 ps for global fitting of XR data aiming at unequivocal comparison of amplitudes of ESA decay. The amplitudes of the time constants characterizing the ESA decay in XR were 58% and 42%, clearly demonstrating the longer lifetime of retinal excited-state in XR. Essentially the same result was obtained when the fast time constant was fixed to 0.7 ps obtained from fitting the near-IR kinetics of XR. We emphasize that no signal from J or K intermediates is present either in the region around 480 nm, or in the near-IR in BR[24], so the slower decay of the excited state in XR is not caused by product formation.
Discussion
Electrochromic shift in XR
We first address the origin of the wavy pattern in the region below 545 nm in XR, which we assigned to electrochromic shift of SX S0-S2 transition. It is known that electrochromic shifts can be modelled by shifting the absorption spectrum of the particular pigment and constructing a difference absorption ‘shifted minus normal’ [25], which is then compared with a transient absorption signal. To apply this approach, we chose the signal recorded at 150 fs after retinal excitation where its amplitude is the largest. In order to extract a pure SX signal in XR, the BR signal was scaled to the GSB at 555 nm and subtracted from the XR transient absorption spectrum. The resulting transient absorption spectrum is best reproduced by a difference spectrum constructed as ‘325-cm-1 blue shifted minus normal’ XR absorption spectrum (Fig. 4). Such shift of the S0-S2 transition reproduces peak positions in transient absorption spectrum at 150 fs, which justifies our conclusion that electrochromic shift of absorption spectrum of SX is responsible for spectral patterns in the high-energy part of transient absorption spectra.
Figure 4.

Comparison of SX transient signal at 150 fs and difference absorption spectrum of XR. The difference absorption spectrum was simulated as ‘325-cm-1 blue shifted minus normal’ absorption spectrum of XR. SX transient signal represents the ‘XR minus BR’ transient absorption spectra at 150 fs normalized to the GSB.
Having established the origin of the wavy pattern in the transient absorption spectra of XR as due to electrochromic shift, we may now proceed to a more quantitative analysis. We adopt here the equation for the Stark shift of transition energy given by [26]:
| (1) |
where Δμ and Δα stand for changes in dipole moment and polarizability between the initial and final state, respectively, ET is the transient electric field induced by excited retinal and Eint is the local stationary electric field experienced by SX. Although quantities in the right side of Eq. 1 are generally vectors (Δα is even tensor), we will first treat them as scalars for simplicity. Our aim is to calculate Eint from Eq. 1 and use this value to calculate the shift of carotenoid S0-S2 transition induced solely by its protein environment. Δν̃ is 325 cm-1 (see above), Δμ and Δα are not known for SX, so we apply those determined for a similar carotenoid astaxanthin [27]: Δμ ≈ 7 D, Δα ≈ 1350 Å3. In order to estimate ET, we use the following formula:
| (2) |
where r is the center-to-center distance between retinal and SX, and ΔμRET is a difference between dipole moments of ground and excited states of retinal in XR. Dielectric constant εr is omitted in Eq. 2 because it not only appears with ε0, but also affects ΔμRET. Thus, if we use the usual value of εr = 2, the correction due to εr would not exceed 10% [28]. The value of ΔμRET is not known for XR, but it has been determined by various techniques for BR [29]. Here we use the consensual value of ΔμRET = 15D used also in [17], which yields ET = 2.8 MV.cm-1.
Now we can calculate the static local electric field experienced by SX, Eint, from Eq. 1. Since there are two possible orientations of Δμ in respect to ET, we obtain two values of Eint, Eint,1 ≈ -4.5 MV.cm-1 and Eint,2 ≈ -1.4 MV.cm-1. Knowing the value of Eint, we can adapt Eq. 1 to calculate shift of SX S0-S2 transition in protein compared to solution (Δν̃P−S). To do this, we replace ET by Eint in Eq.1 and disregard the cross term ΔαEintET since we examine only effect of Eint:
| (3) |
We obtain Δν̃P−S ≈ −240 cm-1 for both values of Eint. This result is close to the observed red shift of Δν̃P−S ≈ −290 cm-1 of SX absorption in XR compared to that in n-hexane (Fig. 1). Thus most of the SX red shift can be explained by local electrostatic interaction, which is in agreement with previous results obtained for purple bacterial antenna LH2[14].
We can further refine our results if we take into account the vector nature of Δμ and ET. We make use of Eq.3 from which we calculate magnitude of Eint’ leading to the experimentally observed red shift of 290 cm-1. The resulting values are: Eint,1’≈ ±1.6 MV.cm-1 and Eint,2’ ≈ ±4.7 MV.cm-1. Then, the vector nature of Δμ and ET is accounted for in Eq. 1 by introducing an angle β between these quantities, leading to
| (4) |
We can calculate β for various combinations of ±Eint,1,2’ and ±Δμ. Since only one such combination, Eint,1’ = −1.6 MV.cm-1 and Δμ = −7 D, results in |cos β| < 1, we obtain a single value of β = 32°.
This result can be corroborated by Fig. 5 showing the field induced by ΔμRET. It is obvious that although part of the SX conjugated system (and thus Δμ) is parallel to ET, some other parts are almost perpendicular to it. Thus the calculated angle of 32°, which represents a ‘mean’ angle between Δμ and ET, is a reasonable estimate. Most importantly, however, while treating the Δμ and ET as scalars gave two possible values of Eint (see above), treating these quantities as vectors allowed to single out the value of |Eint’| ≈ 1.6 MV.cm-1. Finding the unique values of Eint’ and Δμ also allows an evaluation of the contributions of the three terms in Eq. 4 to the observed blue shift. They are 274 cm-1, 342 cm-1, and −292 cm-1, resulting in the observed electrochromic shift of 325 cm-1. Fig. 5 also provides information about the direction of Δμ of SX. Since ΔμRET points from the Schiff base to the retinal ring [17] and since Δμ of SX is negative (see above), it must be opposite to the direction of force lines, and thus have the direction as depicted in Fig.5.
Figure 5.
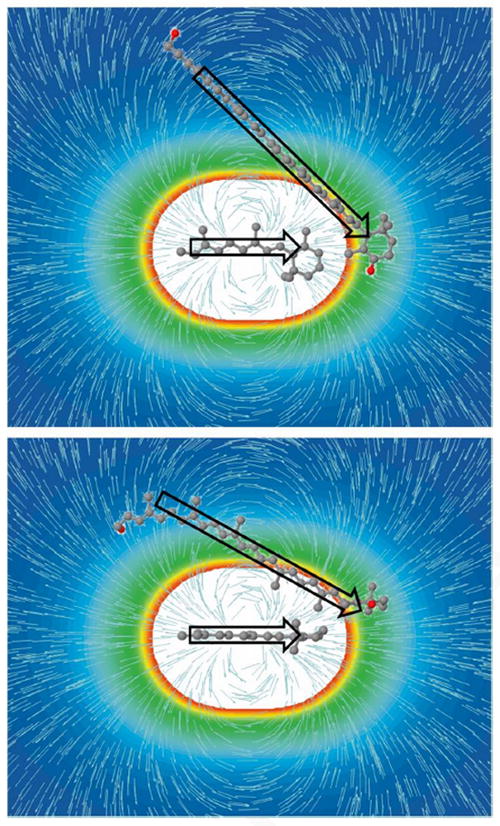
Retinal and SX molecules with the field induced by ΔμRET in XR. The colour coding illustrates the strength of the local electric field ET, while the force lines show its direction. The arrows indicate approximate directions (not magnitudes) of ΔμRET[17] and Δμ of SX. SX acyl chain and glucoside were removed to simplify the picture. Two projections are depicted to better account for positions of chromophores in space.
Dynamics of the electrochromic shift
We will now focus on the dynamics of SX transient signal at 477 nm by searching for a possible correlation of its dynamics with kinetics of other spectral features in the transient absorption spectra of XR. Normalized kinetics recorded at various wavelengths are shown in Fig.6. It is obvious that kinetic taken at 477 nm matches that measured in the near-IR region at 900 nm. Keeping in mind that the SX transient signal is superimposed on the background ESA of retinal, one would expect a modification of the decay at 477 nm if the dynamics of the electrochromic shift were different from those of retinal ESA. Consequently, identity of kinetics at 477 and 900 nm suggests that the electrochromic shift decays with the same rate as the excited state of retinal.
Figure 6.

Normalized kinetics of distinct spectral features of XR. Where necessary, they are inverted and/or translated to enable comparison.
Closer inspection of transient absorption spectra, however, indicates that other intermediates may also contribute to an electrochromic shift. Although the main pattern due to electrochromic response of SX is nearly gone at ~10 ps, it is clear that a weak wavy signal remains even at this delay time (Fig. 2B). Comparing the maxima of the electrochromic response at different delay times, it is clear that the peaks red-shift with time. Since at 10 ps after excitation the excited state of retinal decayed to form photoproducts, it is likely that electrochromic response at this delay time is rather due to the 13-cis isomer of retinal in the photoproducts J/K. This assumption could be tested by subtracting the kinetic at 509 nm (initial position of the peak) from that measured at 515 nm (red-shifted peak). Such procedure should reveal ‘pure’ dynamics of the 515-nm band. Indeed, comparison of the difference kinetic and dynamics of the 635-nm band monitoring a formation of the J/K states reveals a reasonable match (Fig. 7). Consequently, we conclude that the J and K states, corresponding to the ground state configuration of retinal 13-cis isomeras revealed for a closely related BR [10], induce an electrochromic shift of SX. It is in agreement with previous finding that the K intermediate trapped at low temperature causes a small (~2 nm) blue shift of SX bands [1].
Figure 7.

Comparison of the difference kinetics (515 nm minus 509 nm) with the kinetics reflecting the J/K states in XR. The continuous lines resulted from a smoothing procedure. The data are normalized and vertically shifted.
Comparison of BR and XR dynamics
Comparison of kinetics depicted in Fig. 3 clearly shows that retinal excited state decays slower in XR, while the dynamics of GSB (555 nm) and J/K states (635 nm) are similar in BR and XR. This suggests that while the excited-state processes are slower in XR, the dynamics of photoproduct formation is the same in BR and XR. It must be noted, however, that fitting the SE kinetics of BR and XR revealed similar time constants. Time constants for SE of retinal in BR have been reported to be 0.5 ps (95%) and 2 ps (5%)[24], while values of 0.7 ps (64%) and 3.3 ps (36%) have been determined for XR[4]. Our single-wavelength fitting analysis showed corresponding time constants: 0.4 ps (91%) and 2.1 ps (9%) for BR; 0.7 (70%) and 3.3 ps (30%) for XR. Thus, the slower overall excited-state decay in XR is almost solely due to increase of amplitude of the slower, ~3-ps component. The ~2-ps component has been attributed to a 13-cis, 15-synretinal conformation in BR [24] and alternatively to conformational heterogeneity of retinal chromophore environment causing multicomponent decay of the excited state [30]. It is thus possible that either a fraction of the retinal chromophores with longer excited state lifetime in XR is larger than in BR, or that branching occurs in the excited state and a larger fraction evolves through a slower path. One would expect that the difference in excited state decay, clearly seen at 477 nm and 900 nm, could be detected at wavelengths that test mainly ground state recovery (555 nm) and photoproduct formation (635 nm). However, no large differences in kinetics between BR and XR were detected at these wavelengths (Fig. 3). The likely reason is that the two processes (slow decay of the excited state and the J to K transition) occur with similar time constants thus the J does not accumulate and consequently does not contribute to the signal. In addition, the extinction changes during photoproduct formation might be less for XR than for BR at these wavelengths.
It should be noted, however, that direct parallels between BR and XR probably can be applied only cautiously due to differences between these two proton pumps. First of all, the presence of a large molecule such as SX in the vicinity of retinal chromophore may alter properties of the retinal binding pocket[2]. Despite functional similarities between BR and XR, these two proteins have only ~20% of identical amino acids[2]. Although five amino acids closest to retinal in BR (Trp86, Ser141, Thr142, Trp182, and Lys216[17]) are conserved in both BR and XR, two other tryptophans (Trp138 and Trp189) in the proximity of retinal are in XR replaced by Gly156 and Tyr207 involved in SX binding[2]. Perhaps the most relevant difference is that in XR the Schiff base counterion is an aspartate-histidine complex rather than an aspartate as in BR [2]. Sharing of a proton between the aspartate and the histidine would lead to an extended lifetime of the excited state in a fraction of XR pool at neutral pH and especially upon lowering the pH [3], as it does neutralization of Asp85 in BR [31].
Conclusions
We found that excitation of retinal in XR results in a strong electric field, ET = 2.8 MV.cm-1, which causes an electrochromic shift of the SX absorption spectrum that is responsible for a wavy pattern in the blue region of transient absorption spectra. This enabled us to estimate the magnitude of the local electric field strength around SX in XR as 1.6 MV.cm-1. The dynamics of the SX electrochromically shifted spectrum is associated with the decay of excited states of retinal, which is substantially slower than in BR. Additionally, J and K states induce an electrochromic response of SX, though far weaker.
Highlights.
Ultrafast spectroscopy of xanthorhodopsin (XR) and bacteriorhodopsin (BR).
Salinixanthin (SX) in XR exhibits an electrochromic shift after retinal excitation.
Electrochromic shift of SX decays co-ordinately with excited state of retinal.
Differences in ultrafast dynamics of XR and BR were found.
Acknowledgments
Authors thank Arkady Yartsev for help with measurements of the near-IR kinetics. Research in Czech Republic was supported by grants from the Czech Ministry of Education (MSM6007665808 and AV0Z50510513), the Czech Science Foundation (P205/11/1164), and the Grant Agency of University of South Bohemia (038/2010/P). Research in US was supported by grants from the National Institutes of Health (GM29498), the Department of Energy (DEFG03-86ER13525) to J.K.L and the U.S. Army Research Office (W911NF-09-1-0243) to S.P.B.
Footnotes
Publisher's Disclaimer: This is a PDF file of an unedited manuscript that has been accepted for publication. As a service to our customers we are providing this early version of the manuscript. The manuscript will undergo copyediting, typesetting, and review of the resulting proof before it is published in its final citable form. Please note that during the production process errors may be discovered which could affect the content, and all legal disclaimers that apply to the journal pertain.
References
- 1.Balashov SP, Imasheva ES, Boichenko VA, Antón J, Wang JM, Lanyi JK. Science. 2005;309:2061. doi: 10.1126/science.1118046. [DOI] [PMC free article] [PubMed] [Google Scholar]
- 2.Luecke H, Schobert B, Stagno J, Imasheva ES, Wang JM, Balashov SP, Lanyi JK. Proc Natl Acad Sci USA USA. 2008;105:16561. doi: 10.1073/pnas.0807162105. [DOI] [PMC free article] [PubMed] [Google Scholar]
- 3.Balashov SP, Imasheva ES, Wang JM, Lanyi JK. Biophys J. 2008;95:2402. doi: 10.1529/biophysj.108.132175. [DOI] [PMC free article] [PubMed] [Google Scholar]
- 4.Polívka T, Balashov SP, Chábera P, Imasheva ES, Yartsev A, Sundström V, Lanyi JK. Biophys J. 2009;96:2268. doi: 10.1016/j.bpj.2009.01.004. [DOI] [PMC free article] [PubMed] [Google Scholar]
- 5.Zhu J, Gdor I, Smolensky E, Friedman N, Sheves M, Ruhman S. J Phys Chem B. 2010;114:3038. doi: 10.1021/jp910845h. [DOI] [PubMed] [Google Scholar]
- 6.Polívka T, Frank HA. Acc Chem Res. 2010;43:1125. doi: 10.1021/ar100030m. [DOI] [PMC free article] [PubMed] [Google Scholar]
- 7.Fujimoto KJ, Hayashi S. J Am Chem Soc. 2009;131:14152. doi: 10.1021/ja905697n. [DOI] [PubMed] [Google Scholar]
- 8.Kobayashi T, Saito T, Ohtani H. Nature. 2001;414:531. doi: 10.1038/35107042. [DOI] [PubMed] [Google Scholar]
- 9.Dobler J, Zinth W, Kaiser W, Oesterhelt D. Chem Phys Lett. 1988;144:215. [Google Scholar]
- 10.Mathies R, Cruz CHB, Pollard WT, Shank CV. Science. 1988;240:777. doi: 10.1126/science.3363359. [DOI] [PubMed] [Google Scholar]
- 11.Nuss MC, et al. Chem Phys Lett. 1985;117:1. [Google Scholar]
- 12.Sharkov AV, Pakulev AV, Chekalin SV, Matveetz YA. Biochim Biophys Acta. 1985;808:94. [Google Scholar]
- 13.Herek JL, Polívka T, Pullerits T, Fowler GJS, Hunter CN, Sundström V. Biochemistry. 1998;37:7057. doi: 10.1021/bi980118g. [DOI] [PubMed] [Google Scholar]
- 14.Herek JL, Wendling M, He Z, Polívka T, Garcia-Asua G, Cogdell RJ, Hunter CN, van Grondelle R, Sundström V, Pullerits T. J Phys Chem B. 2004;108:10398. [Google Scholar]
- 15.Schenkl S, van Mourik F, van der Zwan G, Haacke S, Chergui M. Science. 2005;309:917. doi: 10.1126/science.1111482. [DOI] [PubMed] [Google Scholar]
- 16.Schenkl S, van Mourik F, Friedman N, Sheves M, Schlesinger R, Haacke S, Chergui M. Proc Natl Acad Sci USA. 2006;103:4101. doi: 10.1073/pnas.0506303103. [DOI] [PMC free article] [PubMed] [Google Scholar]
- 17.Léonard J, Portuondo-Campa E, Cannizzo A, van Mourik F, van der Zwan G, Tittor J, Haacke S, Chergui M. Proc Natl Acad Sci USA. 2009;106:7718. doi: 10.1073/pnas.0812877106. [DOI] [PMC free article] [PubMed] [Google Scholar]
- 18.Antón J, Oren A, Benlloch S, Rodríguez-Valera F, Amann R, Rosselló-Mora R. Int J Syst Evol Micrbiol. 2002;52:485. doi: 10.1099/00207713-52-2-485. [DOI] [PubMed] [Google Scholar]
- 19.Imasheva ES, Balashov SP, Wang JM, Smolensky E, Sheves M, Lanyi JK. Photochem Photobiol. 2008;84:977. doi: 10.1111/j.1751-1097.2008.00337.x. [DOI] [PMC free article] [PubMed] [Google Scholar]
- 20.Oesterhelt D, Stoeckenius W. Methods Enzymol. 1974;31:667. doi: 10.1016/0076-6879(74)31072-5. [DOI] [PubMed] [Google Scholar]
- 21.van Stokkum IHM, Larsen DS, van Grondelle R. Biochim Biophys Acta. 2004;1657:82. doi: 10.1016/j.bbabio.2004.04.011. [DOI] [PubMed] [Google Scholar]
- 22.Hasson KC, Gai F, Anfinrud PA. Proc Natl Acad Sci USA. 1996;93:15124. doi: 10.1073/pnas.93.26.15124. [DOI] [PMC free article] [PubMed] [Google Scholar]
- 23.McCamant DW, Kukura P, Mathies RA. J Phys Chem B. 2005;109:10449. doi: 10.1021/jp050095x. [DOI] [PMC free article] [PubMed] [Google Scholar]
- 24.Wu YS, Zhong S, Ai XC, Hu KS, Zhang JP. Chinese Science Bulletin. 2008;53:1972. [Google Scholar]
- 25.Romero E, van Stokkum IHM, Dekker JP, van Grondelle R. Phys Chem Chem Phys. 2011;13:5573. doi: 10.1039/c0cp02896g. [DOI] [PubMed] [Google Scholar]
- 26.Rätsep M, Wu H-M, Hayes JM, Blankenship RE, Cogdell RJ, Small GJ. J Phys Chem B. 1998;102:4035. [Google Scholar]
- 27.Krawczyk S, Olszowka D. Chem Phys. 2001;265:335. [Google Scholar]
- 28.Pullerits T, Chachisvilis M, Sundström V. J Phys Chem. 1996;100:10787. [Google Scholar]
- 29.Colonna A, Groma GI, Martin J-L, Joffre M, Vos MH. J Phys Chem B. 2007;111:2707. doi: 10.1021/jp0673462. [DOI] [PubMed] [Google Scholar]
- 30.Gai F, Hasson KC, McDonald JC, Anfinrud PA. Science. 1998;279:1886. doi: 10.1126/science.279.5358.1886. [DOI] [PubMed] [Google Scholar]
- 31.Song L, El-Sayed MA, Lanyi JK. Science. 1993;261:891. doi: 10.1126/science.261.5123.891. [DOI] [PubMed] [Google Scholar]