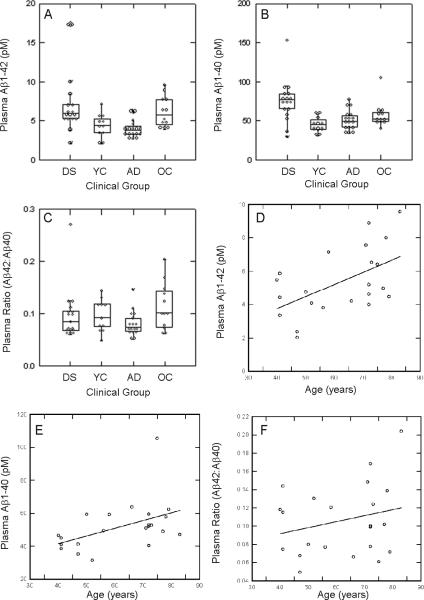
Figure 1.
Individual and group differences in plasma Aβ in Study 1. (A) Plasma Aβ1-42 was significantly higher in nondemented adults with DS relative to similarly aged young controls (YC). Patients with AD had lower plasma Aβ1-42 than nondemented adults with DS. (B) Plasma Aβ1-40 was highest in nondemented adults with DS relative to young controls (YC), old controls (OC) and patients with AD. (C) No differences across groups were noted in the ratio of Aβ42:Aβ40. Higher amounts of plasma Aβ1-42 (D) and Aβ1-40 (E) are associated with increased age in individuals without DS. However, the ratio of Aβ42:Aβ40 was stable across age (F). In the box plots, horizontal lines represent the median, the bottom line is the 25th percentile and the top line is the 75th percentile. Individual data points are shown. Lines indicate significant differences in post hoc Bonferroni comparisons at the p<.05 level. Lines represent a linear regression.

