
Fig. 3. N-acetylcysteine decreases intracellular ROS levels.
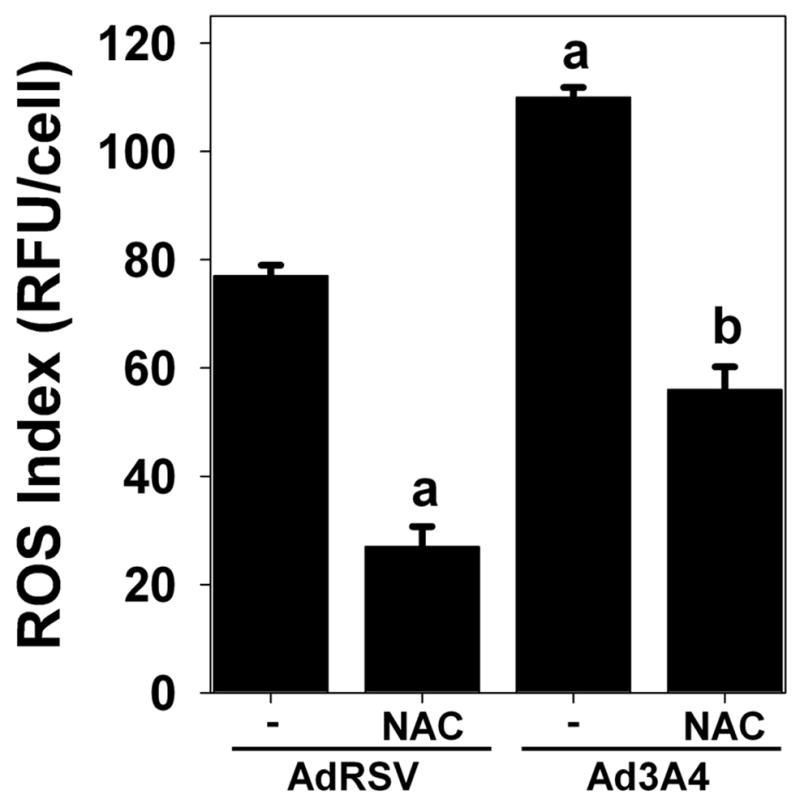
HepG2 cells were infected with control adenovirus (AdRSV) or adenovirus containing CYP3A4 (Ad3A4) at MOIs of 25, in the presence (NAC) or absence (−) of 5 mM N-acetylcysteine, as described in the Methods. Cells were subsequently treated with 5 μM RedoxSensor Red, which is not fluorescent until oxidized, before quantitative analysis of the fluorescent signal by microscopy. Columns and crossbars represent the mean and SE, respectively, of the relative fluorescent units (RFU) per cell for over 100 cells/group. aData significantly different from AdRSV group (p<0.05). bData significantly different from Ad3A4 group (p<0.05).