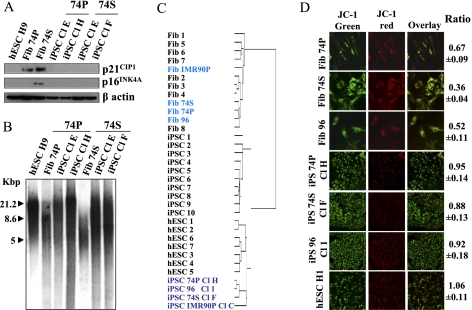
Figure 3.
Disappearance of senescence markers in senescent cell-derived iPSCs. (A) Decrease of p21CIP1 and p16INK4A protein level in iPSCs generated from 74P and 74S cells compared with parental fibroblasts and H9 hESCs, analyzed by Western blotting. β-Actin was used as a loading control. (B) TRF analysis of iPSC clones generated from 74P and 74S cells compared with their parental fibroblasts and H9 hESCs; TRF length is in kilobases (kb). (C) Nonsupervised hierarchical clustering of the global gene expression profiles in fibroblasts, iPSCs, hESCs, and 74- and 96-yr-old fibroblasts and their corresponding iPSCs. (D) Reprogramming of mitochondrial function in iPSCs derived from 74P and 74S and aged 96 cells compared with H1 hESCs, analyzed by JC-1 red/green fluorescence ratio measured by FACS. Red fluorescence indicates a normal membrane potential and green fluorescence indicates a membrane depolarization. A decreasing ratio measures the extent of mitochondrial dysfunction. Experiments were performed in triplicate (±SD for standard deviation).

