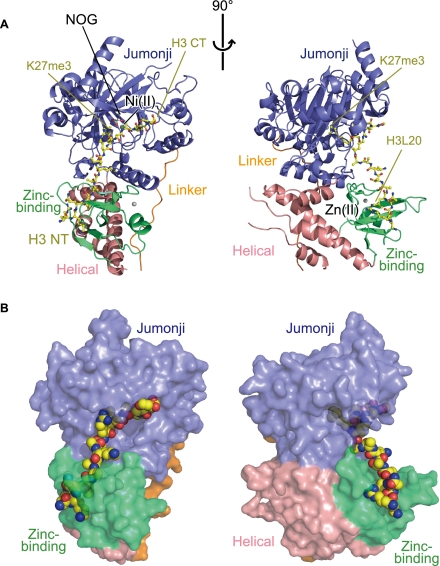
Figure 2.
Overall structure of the UTX•H3 complex. (A) Orthogonal views of the overall structure of the UTX•H3 complex. UTX is shown in a ribbon representation. The bound H3 peptide (yellow), NOG (white), Ni(II) (pale green), and Zn(II) (silver) are shown in a ball-and-stick representation. The N and C termini of the H3 peptide are labeled with “H3 NT” and “H3 CT,” respectively. (B) Same as A, but UTX and the H3 peptide are shown in surface and space-filling representations, respectively.

