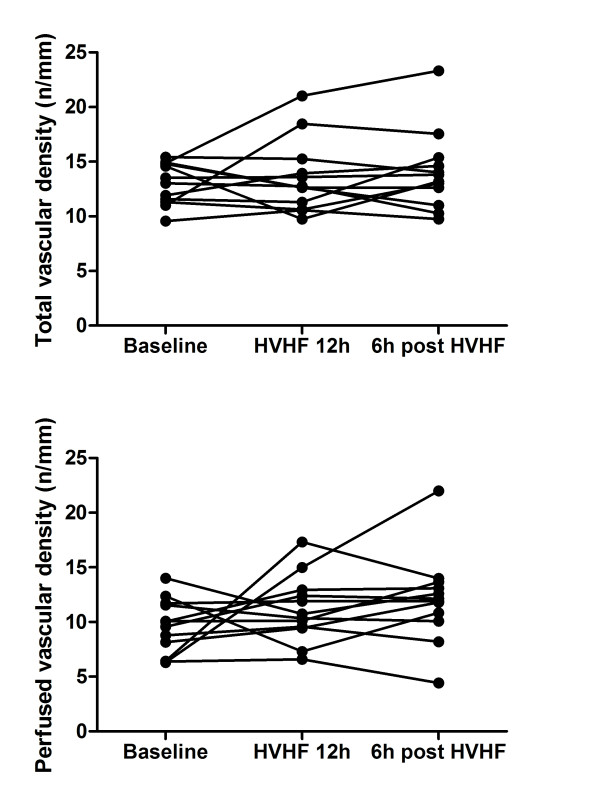
Figure 1.
Effects of high-volume hemofiltration (HVHF) on sublingual microvascular density. The graphs present the individual evolution of total vascular density (upper graph) and perfused vascular density (lower graph) of small vessels (< 20 μm) at baseline, at the end of the 12-hour period of HVHF, and 6 hours after stopping HVHF. There was no significant change. Density is expressed as the number of vessels divided by the total length of the gridline in millimeters.

