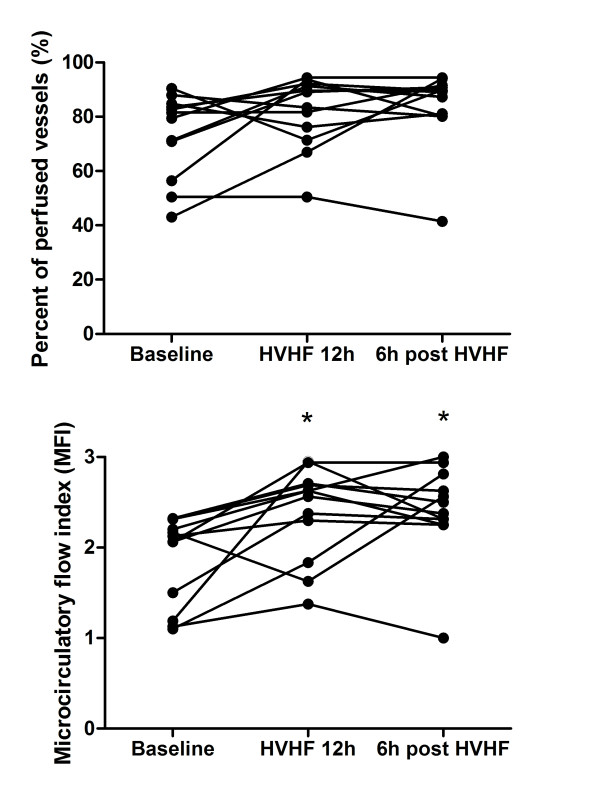
Figure 2.
Effects of high-volume hemofiltration (HVHF) on sublingual microvascular flow. The graphs present the individual evolution of flow assessed by the percentage of perfused vessels (upper graph) and by the microvascular flow index (lower graph) of small vessels (< 20 μm) at baseline, at the end of the 12-hour period of HVHF, and 6 hours after stopping HVHF. *P < 0.05 compared with baseline.

