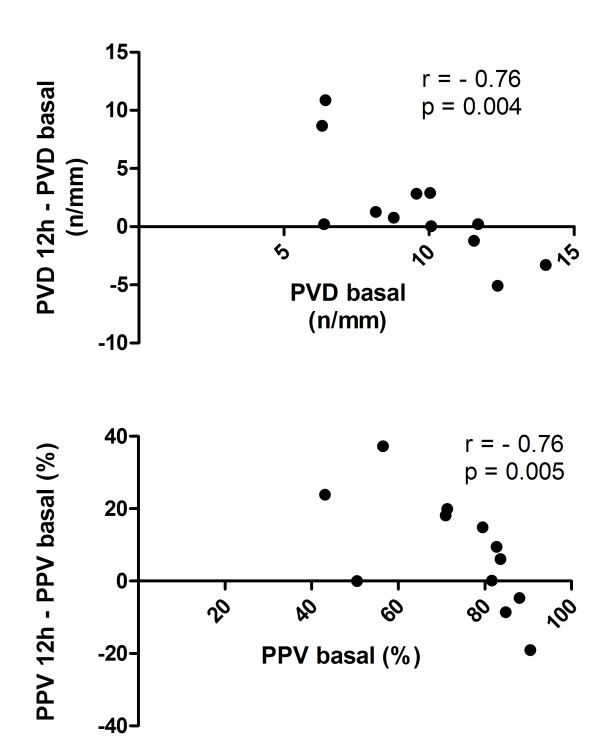
Figure 3.
Relationship between baseline sublingual microcirculatory parameters and their change during the 12-hour high-volume hemofiltration (HVHF). The upper graph shows a significant correlation between baseline values of perfused vascular density (PVD) and their variation during the 12-hour HVHF. The lower graph shows a similar correlation between the baseline values of the percentage of perfused vessels (PPV) and their variation during the 12-hour HVHF. Both PVD and PPV were calculated for small vessels (< 20 μm). Density is expressed as the number of vessels divided by the total length of the gridline in millimeters.

