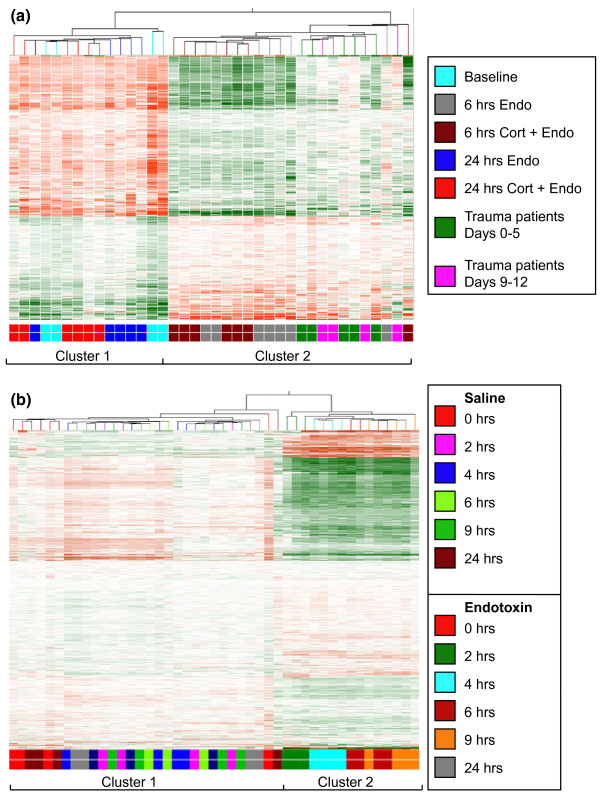
Figure 2.
Clustering analysis of TLR4 and injury responsive (TIR) genes. (a) The panel depicts hierarchical cluster analysis of the 445 TIR genes selected from 38 Gene Chip® Focus Array database described in Table 2. (b) The panel depicts hierarchical cluster analysis of TIR genes selected from a 45 Hu133B® Array database described in [3]. Due to probe replicates, the 445 TIR genes are represented by a total of 823 probes sets.

