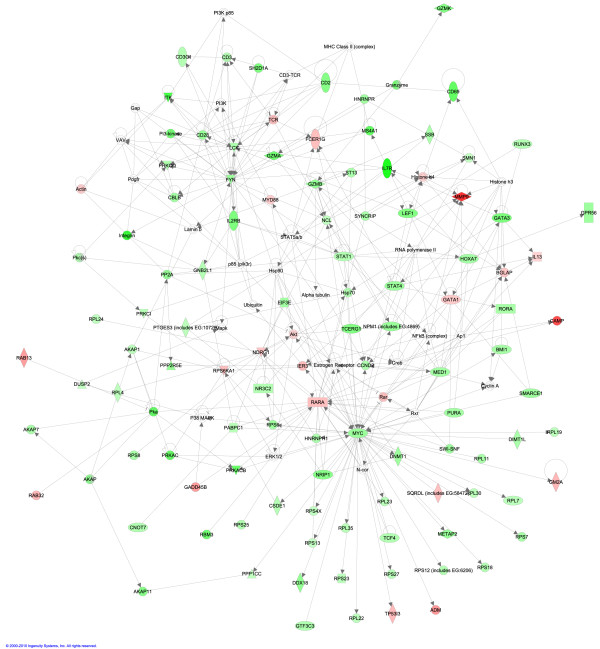
Figure 3.
TLR4 and injury responsive (TIR) genes pathway analysis. To determine the putative biological role of the TIR genes, the expression data were analyzed through the use of Ingenuity Pathway Analysis. The top ranking module shown in this figure includes 99 TIR genes. Myc, depicted on the lower right, is the focal point for the most densely populated node that includes numerous RPL/RPS genes.

