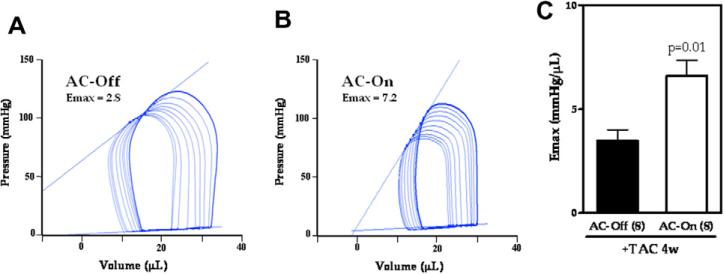
Fig. 2.
(A, B) Representative pressure–volume curves for an animal in each group (4 weeks after TAC). Emax was obtained from the slope of the end-systolic pressure–volume points on successive loops during inferior vena cava occlusion. (C) AC-On animals showed increased Emax values, indicative of increased LV contractility. Error bars represent SE.

