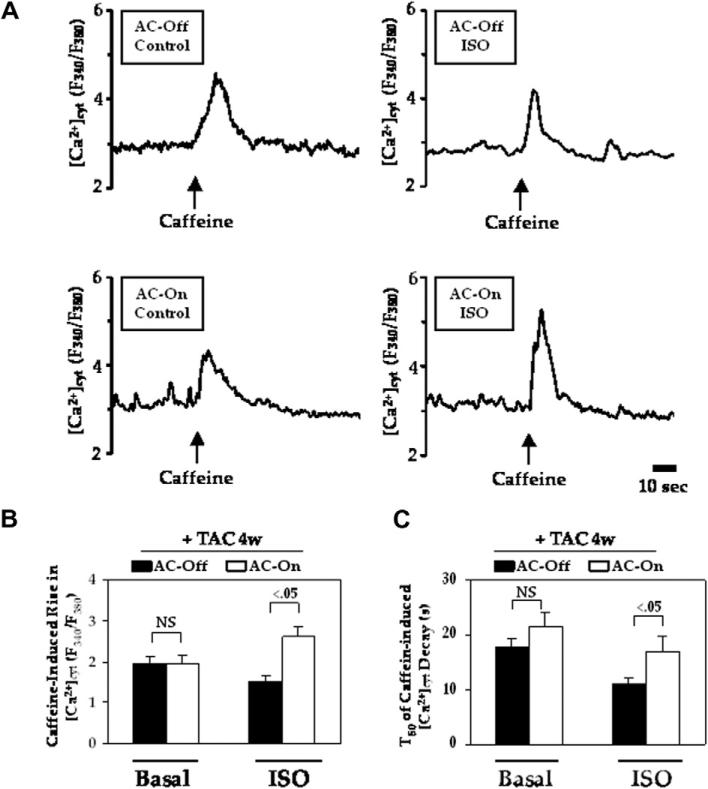
Fig. 3.
Isoproterenol stimulated caffeine-induced Ca2+ release in isolated cardiac myocytes 4 weeks after TAC. (A) Representative [Ca2+]cyt traces in isoproterenol-stimulated myocytes, averaged from 5 to 8 individual cells. (B) Caffeine-induced rise in [Ca2+]cyt, indicating Ca2+ release from SR. (C) The time required for a 50% reduction of the peak caffeine-induced intracellular Ca2+ level (T50) was longer in AC-On when stimulated with isoproterenol. Error bars denote SE. Between-group comparisons were made using two-way ANOVA with Bonferroni post hoc test.

