Figure 1.

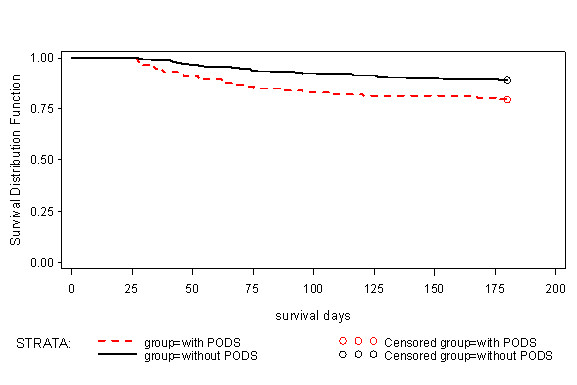
Kaplan-Meier curve comparing time to death of patients who were alive with and without POD at Day 28. Patients alive at six months were censored. Differences between curves assessed with log-rank test, P = 0.007.

Kaplan-Meier curve comparing time to death of patients who were alive with and without POD at Day 28. Patients alive at six months were censored. Differences between curves assessed with log-rank test, P = 0.007.